
I have never understood the purpose of year-end price targets for the stock market. Every bank issues them. And each year, they offer eternally optimistic views on how the 365-day period will play out. (There’s never a bear in the picnic basket!)
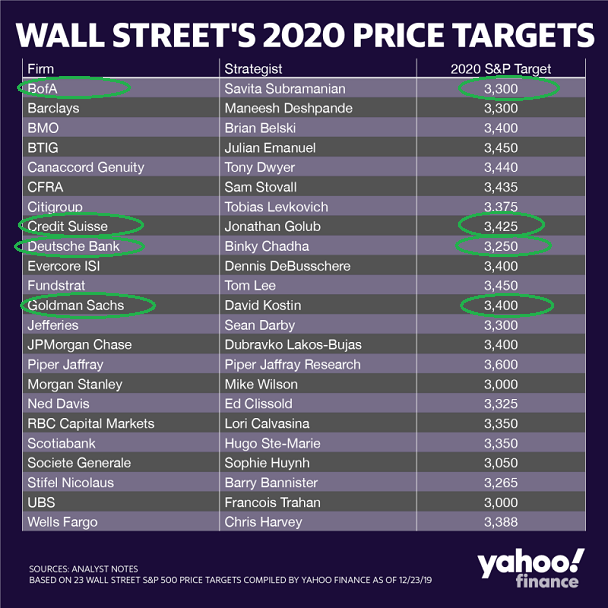
The banks are not capable of predicting the year-end price of the market. So why do the media solicit opinions from these firms to take a stab at calling the bear market bottom?
The S&P 500 closed at a new 52-week low of 2237.40 on March 23, 2020. Days later, with the S&P catapulting 300-plus points, Wall Street is already wondering if Credit Suisse wins a free chicken dinner.
Not surprisingly, Main Street is not interested in timing the technical bottom. In the real economy, people are discussing layoffs, cash flow, bankruptcy and financial survival.
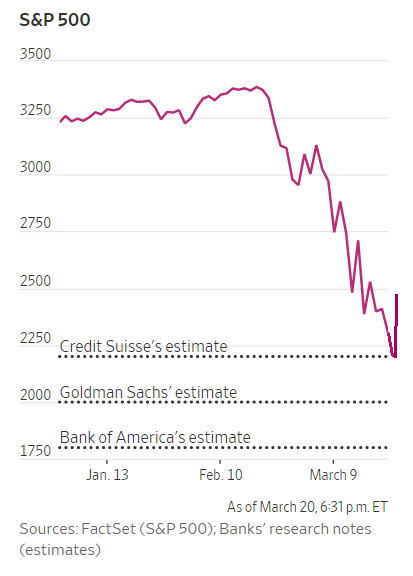
That said, the “guestimates” are still going to come. For example, to the extent fundamental valuation still matters, a median S&P 500 P/E of 14.82 would suggest an S&P 500 bottoming near the 1970 level. This dovetails with Goldman Sachs’ prediction in the chart above.
Unfortunately, markets tend to overshoot fair value on the way down. The notion that everything will get better when extremely overvalued equities hit fair value seems fanciful.
Another possible way to bottom fish? Looking for the recession’s mid-point.
Remember, risk taking often becomes beneficial about halfway to two-thirds through the period of economic contraction. So if you’re one who subscribes to this notion, simply identify the recession time horizon. (Easy, right?)
According to the folks at Oxford Economics, the depth of recession will be worse than the 2008 financial crisis, but the V-shaped recovery will be epic in its ascent. Using the projections as a “base case,” the economic downturn began in March. And the expansion may ignite as soon as August.
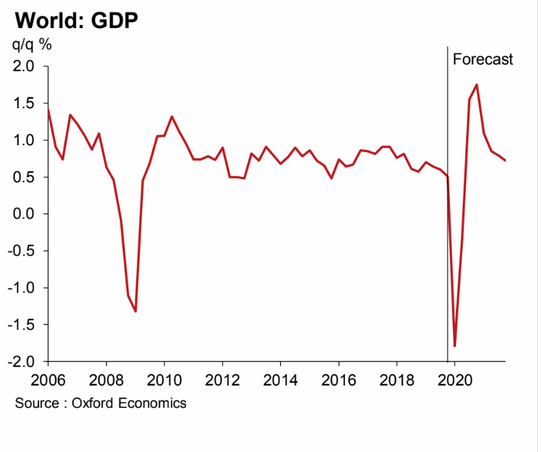
In this exercise, a bottoming out would occur around the end of May. Bottom-seekers might wish to “re-risk” in everything from foreign equities to fallen angels — BBB-rated corporations that fell into the high yield debt (BB) category.
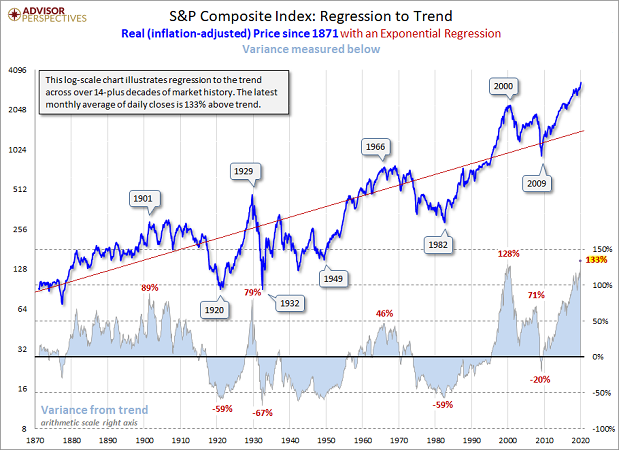
There’s another possibility that most will not like. And it is often referred to as the “Iron Rule.” Specifically, reversion to the mean (regression to the trend) suggests that the bottom would be a 57.6% decline to the 1400 level for the S&P 500.
Why such a monster sell-off? Essentially, the stock bubble peak in 2000 marked an unprecedented 128% overshooting of the trend. That was leaps and bounds worse than the price move above the trend in the bubbles of 1901 and 1929.
For most of the 21st century, though, the Federal Reserve has done everything in its power to keep stocks permanently elevated above a regression trendline. In 2020, they pushed it to 133% above trend. And that’s why regression analysis place the S&P 500 down around 1400.
Granted, nobody wants to think about the prospect of reversion to the mean in stocks. Nevertheless, even if one rejects the concept, one might need to consider that the 2237 lows from March 23rd might not hold.
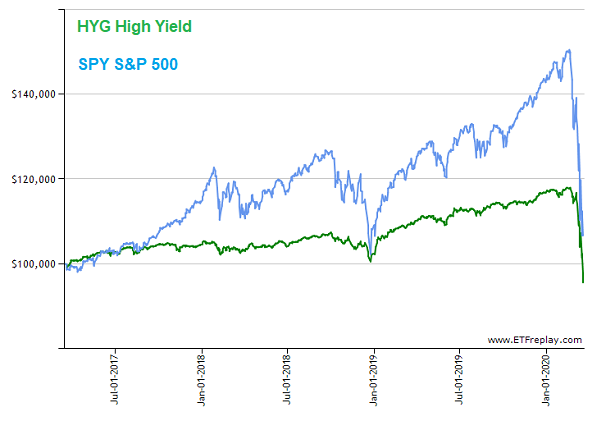
Consider the fact that total returns for high yield bonds here in 2020 definitively cracked the Christmas 2018 lows. That increases the likelihood that the S&P 500 will follow suit.
It is true that the ongoing relief rally is providing comfort. Maybe COVID-19 will run its course quickly. And maybe the unprecedented stimulus levels will reflate the 2020 stock bubble anew.
On the other hand, the financial markets will need to assess the progress of containing the coronavirus as well as the bounce-back-ability of corporations. Which ones go bankrupt? Which ones get bailouts?
On top of that, financial markets still need to assess the internal damage at the corporations that we invest in. Revenue and profitability concerns are real. Assets like stocks are unlikely to head straight back to the stratosphere when the sales and profits of companies are floundering. After all, it’s the sales and profits that largely determine what investors are “buying into” such that, post-virus, stocks may need to be re-priced lower.
None of this is to suggest that things won’t improve rapidly. They might. Nor am I suggesting a doomsday scenario.
There have been opportunities to buy panic in the preferred space – preferred shares for established companies from Digital Realty Trust (DLR) and QTS Realty Trust (QTS). And the price deviations from Net asset value (NAV) in munis made iShares National Muni (MUB) as well as VanEck Vectors High Yield Muni (HYD) difficult to pass up. After all, the Fed is buying muni bonds alongside mortgage-backed securities and short-term corporate credit.
Before celebrating the two-day turnaround in the stock indexes themselves, though, recognize the unlikelihood of quick resolution on a half dozen fronts. For example: (1) Scores of corporations will need to borrow more money and they will need to do so at higher interest costs, (2) Surging unemployment rates will put a damper on consumption habits for a bit longer than many are factoring in, (3) Stock buybacks that helped fuel the 2009-2019 bull market will be curtailed, (4) CEOs will have a tough time in April with an ability to provide meaningful forward guidance on earnings, (5) Risk taking itself may be compromised in a post-virus world, and (6) Short-sellers take profits in bear rallies.
The best way to invest amid the heightened volatility? Make sure that you adhere to your systematic process. If you do not have a process that ignores price targets and predictions, then get one.
Anxiety, glee, disgust, sadness, boredom, fear, anticipation, anger, surprise, boredom, amusement, enthusiasm – we are all human. We’re all going to feel these emotions. Yet abiding by the rules of your process keeps emotions out of your financial decision-making.