Many in the mainstream financial media have been declaring that the current bear is one of the worst in history. That is incorrect. As least as far as stocks go.
With respect to stock price decline, the S&P 500’s 23%-24% fall from grace has yet to reach average bear market proportions. The median stock bear registers -32% from top to bottom.
The talking heads may be attempting to convey an unfortunate reality for a balanced stock-bond portfolio. The proverbial 60-40 mix. Indeed, through the first nine calendar months, the 20% losses rank as the worst in history.
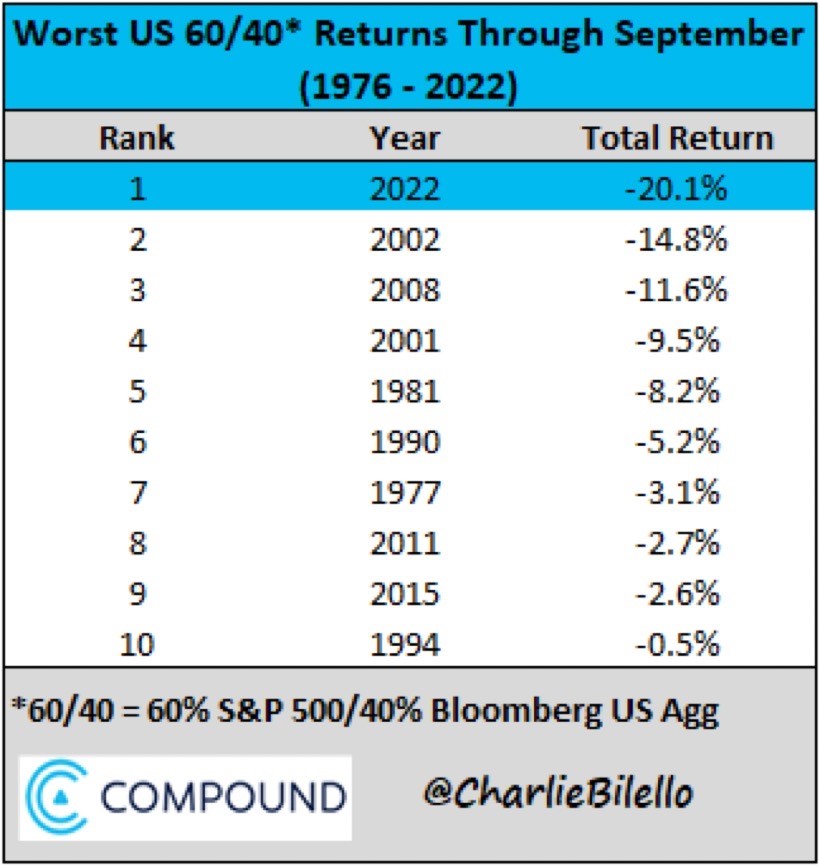
In previous stock bears, investment grade bonds diversified the risk of owning equities. That has not been the case this year. Not with the Fed’s aggressive monetary policy tightening to fight inflation.
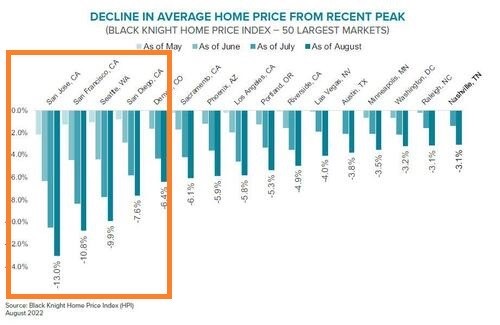
Some erroneously believe that home prices are holding up. That would not be accurate either.
For one thing, sales have plummeted such that there is virtually no activity in a 6.5%-7% 30-year mortgage rate environment. The real estate market is not liquid. For another, the hottest real estate markets are experiencing price declines that have not been witnessed since the 2006 housing bubble popped.
If there are any positives for investors, it would be that bonds have been battered nearly as much as they are likely to be. A 2-Year Treasury Note yielding 4.30%? That will not be available next year or the year after. Many should start looking at investment grade bonds — Treasuries and corporates — yielding 4%-6%.
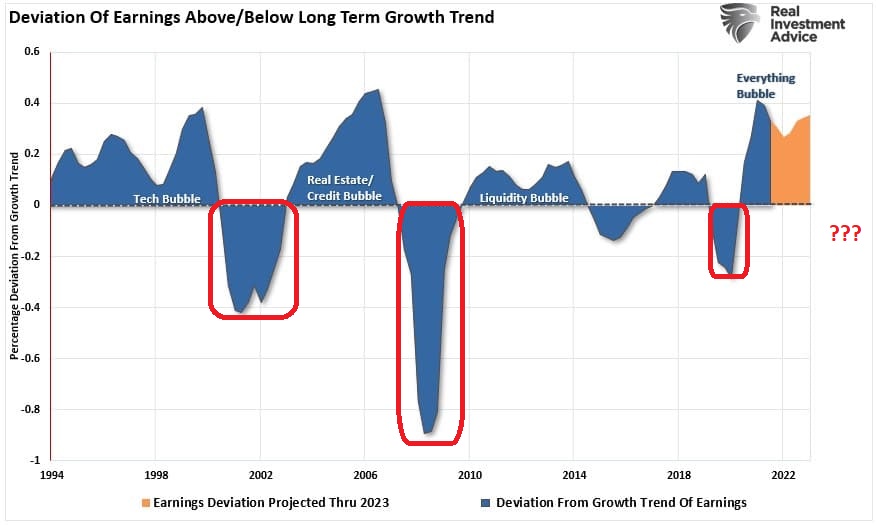
Stocks are another story. They have yet to price in the genuine possibility of a sharp decrease in earnings, let alone the economy floundering in recession. It is almost as if the investing community simply believes that when the Fed “pivots” to neutral, ceasing to reduce its balance sheet and/or refraining from additional rate increases, all will be well.
Unfortunately, despite the existing declines in stock prices, the sharp hit to earnings will mean that stocks will still be expensive. That would imply they’d have further to fall when recessionary pressures hit. Like 2001, 2008, and 2020.
So what might it really take for stocks to get their mojo back? Total Federal Reserve capitulation. And by that, I do not mean a mere “Fed pivot.”
The Fed will likely need to return to a world of stimulus. Rate cuts. Electronic money printing.
Here are three pathways to eventual Fed capitulation:
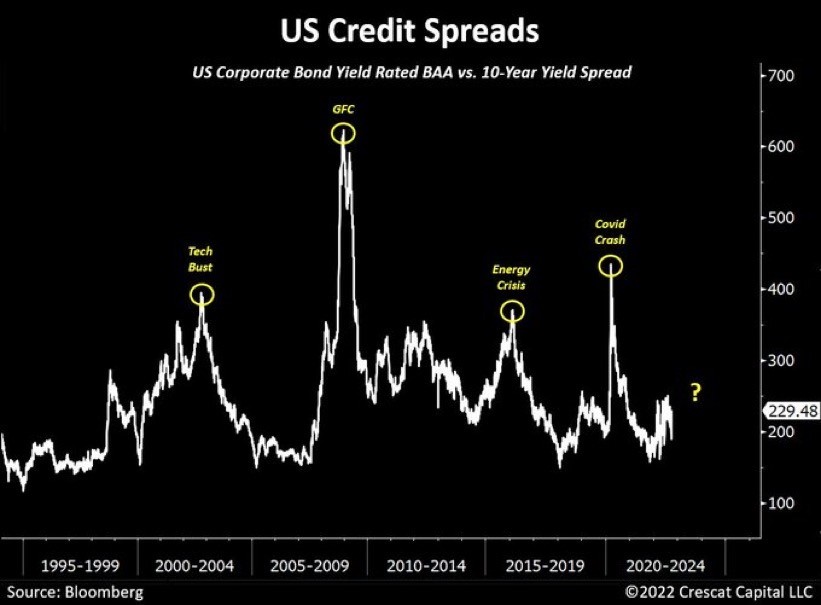
(1) Credit Market Eventually Breaks. In every circumstance where the Federal Reserve finds itself enacting more monetary juice, spreads spiked dramatically. Investment grade bond proxies soared relative to comparable Treasury yields.
We have yet to see a credit spread spike. When it happens, one should expect the Fed to be more afraid of market functioning and recession than worrying about inflation.
(2) As Stocks Plummet, Long Bond Prices Eventually Surge. In the current environment, higher bond yields spark stock sell-offs. And vice versa. Lower bond yields spark stock rallies. It is as basic as that.
However, there will come a time when investors will seek out Treasuries for safety and security. They will buy the longer-dated maturities as represented by proxies like iShares 20+ Year Treasury (TLT).
When long bonds are gaining as a means to seek safety from a stock bear, and when stocks are still getting battered day out and in, the Fed will shift quickly. They will find themselves needing to fight off a hard landing recession rather than continue the inflationary battle.
Right now, though, TLT keeps losing in the same pattern as the S&P 500. The exchange-traded fund TLT will buck the S&P 500 trend when recession becomes scarier than inflation.
(3) Investors Eventually Throw In the Allocation Towel. Many a guru has been predicting the end of the stock bear week in and week out. They’ve been wrong, of course.
These shoot-from-the-hippers have been relying on a single contrarian indicator: Sentiment. Specifically, investors describe themselves as so incredibly bearish, a stock bull should begin immediately.
Indeed, you will not find many times in history when the American Association of Individual Investors (AAII) reports 60%-plus bearishness for seven consecutive weeks. On the other hand, the behaviors of these investors is entirely incongruent with their feelings. Believe it or not, people are still holding onto more than 60% in their stock allocation.
In the bear market lows of the past — 1990, 2002, 2009 — investors had raised cash to a degree where they only had 40% left in equities. With stock exposure in the 60%-plus category and cash exposure down in the 20% arena, we are a far cry from anyone throwing in the towel.
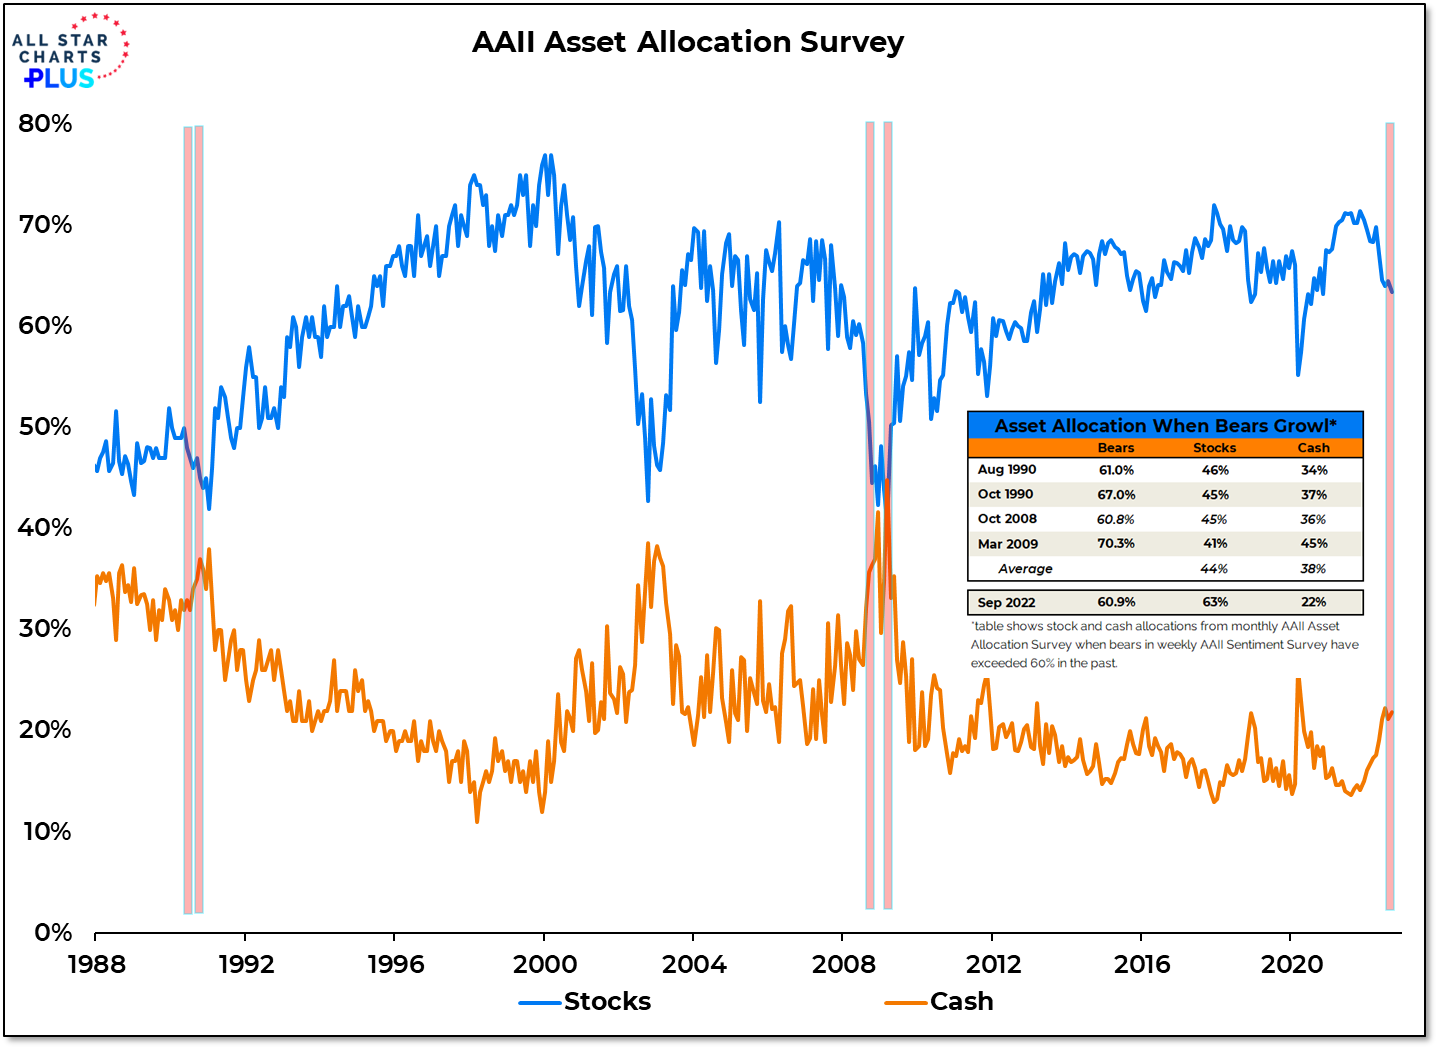
Until cash levels in the orange line above move sharply higher, and until stock levels in the blue line above move sharply lower, the stock bear is unlikely to end. And that may be very difficult for the sentiment folks to accept.
Would you like to receive our weekly newsletter on the stock bubble? Click here.