
“Insanity is doing the same thing over and over again but expecting different results” — Narcotics Anonymous
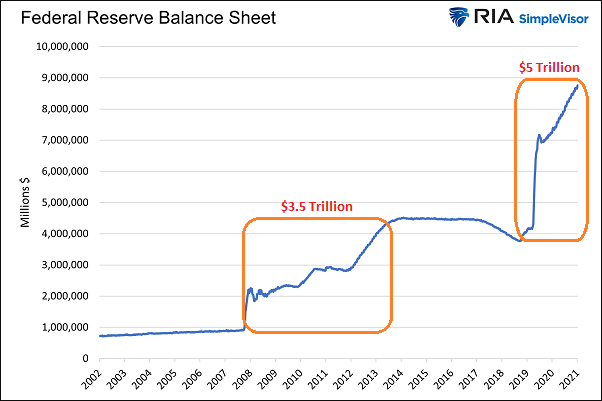
The Federal Reserve digitally printed roughly $3.5 trillion dollars between 2008 and 2014. In that brief period, the Fed created three centuries’ worth of growth in the money supply.
And the central bank of the United States was not finished yet.
The Fed electronically printed nearly $5 trillion dollars in the heat of the pandemic (2020-2021). Then, the government found a way to spend approximately $5-$6 trillion in borrowed money stimulus.
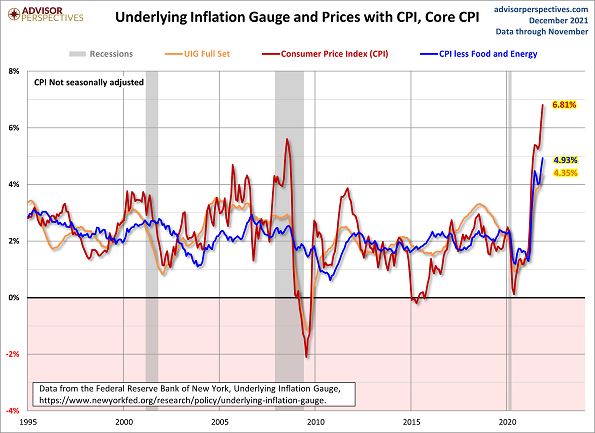
Prices for goods and services did not spike during the previous decade’s money printing. Only asset prices (e.g., stocks, bonds, etc.) rocketed.
During the second go-around, however, the government handed out trillions to families and businesses. The deficit spending and unprecedented year-over-year growth of the money supply led to significant inflationary pressures.
Since consumer price inflation did not rise meaningfully in the 2010s, Fed officials assumed that there was little cost to digital money creation via quantitative easing (QE). They did not see the insanity of creating dollars out of the ether.
In contrast, doing even more of the same activity in the 2020s resulted in rising prices across the board. Stocks, bonds, real estate, crypto, NFTs, collectibles — sure. But now the inflation has included food, energy, commodities, vehicles, machinery, leisure, hospitality, health care, clothing, furniture, jewelry, and rent.
Everything costs a leg and an arm more than before.
Producer price inflation and consumer price inflation was tame the first time… so why should committee members have expected inflation to get ugly the second time around? Was the Fed wrong to do the same thing again?
Perhaps we need to redefine insanity. Or at least look further back in history to see that no country has ever gotten away scot-free by printing gobs and gobs of its fiat currency.
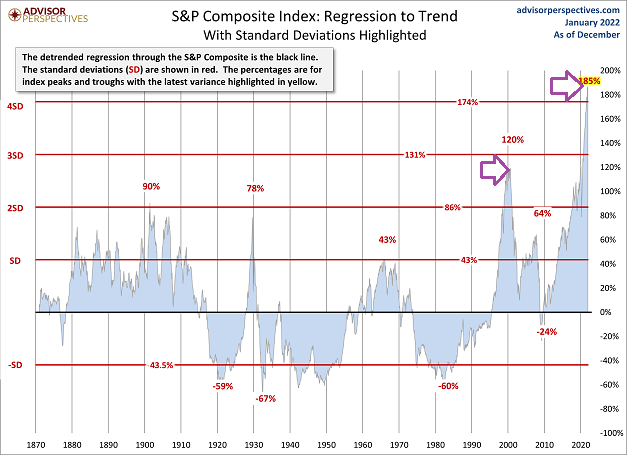
Without question, the Federal Reserve’s easy money policies have produced the largest stock bubble in U.S. history. Current stock prices are four standard deviations above a long-term growth trend, pushing prices to a precarious peak that rivals the March 2000 precipice.
Going forward, one might need to consider how the inflation quagmire changes the game. Politically speaking, lawmakers have been whittling down the size and scope of the infrastructure package. Meanwhile, the Fed finds itself forced to raise rates to give the impression it is fighting inflation in earnest.
If low interest rates have been “justifying” high stock valuations, will higher rates put a dent in that mantra? If ultra-accommodative monetary policies supported higher stock prices in the past, will tightening alter the narrative?
Granted, there is widespread belief that the Fed will choose asset price support (e.g., stocks, real estate, etc.) over inflation fighting. Yet the choice may not be binary; that is, decision makers may need to travel a treacherous path that involves rate hikes alongside a promise to reverse course at the drop of a dime.
Will it work? It might.
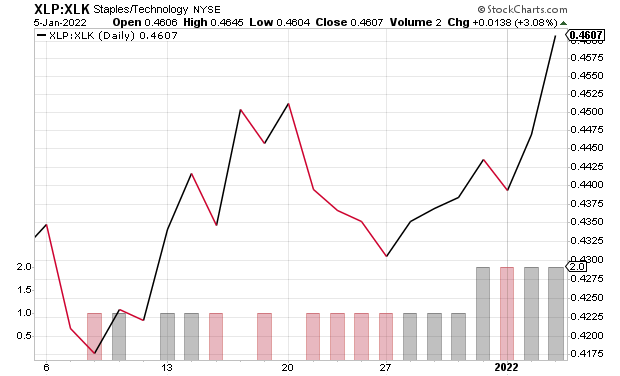
On the flip side, safer haven consumer staples (XLP) have dramatically outperformed technology stocks (XLK) over the last month. That may be a sign of risk aversion gaining a foothold.
Would you like to receive our weekly newsletter on the stock bubble? Click here.