You have chosen to blame the COVID-19 pin prick. Yet, you should have understood that the Federal Reserve’s obsession with recession prevention created a monstrous stock bubble.
I did not tell you when falling stock prices would cease to be a buy-the-dip opportunity. I cannot predict the future. Nobody can.
Still, I explained how the Fed’s relentless pursuit of a wealth effect had resulted in a frothy asset blob. And I described what happens to everything from consumption to unemployment shortly after the rupturing of a balloon. What’s more, I made clear that the severity of the wealth effect reversal would usher in the next recession.
You scoffed at my tactical allocation. If I had 50%-55% in large company stocks for my near-retiree and retiree client base, with a whole lot of risk-off Treasury bonds to boot, you insisted it should have been 70%-75% in stock. When I favored REITs, utilities, health care, dividend aristocrats and a bit of beta via Vanguard Mega Cap ETF (MGC), you called me too conservative.
Why wouldn’t I be more aggressive with the broader S&P 500 SPDR Trust (SPY) or Nasdaq 100 (QQQ)? Didn’t I see game-changers in everything from artificial intelligence to marijuana growers?
The economy is always changing. Of course I paid attention.
However, I realized that the fundamental earnings picture was ludicrous. And that was long before the coronavirus became part of the country’s daily lexicon.
Just how ludicrous? Here is a sample of the insanity – charts and data that I have been compiling at my 2020 web log, TheStockBubble.com.
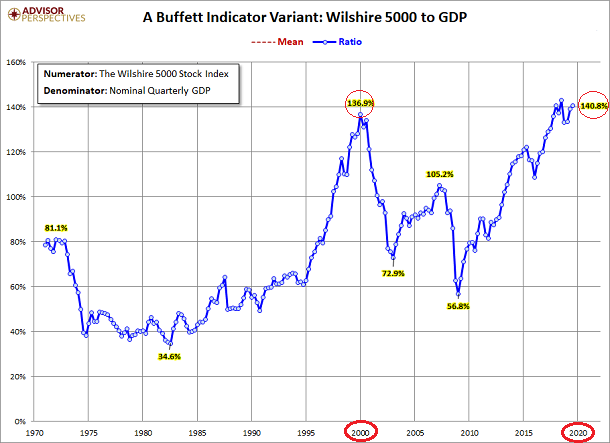
January 1, 2020: Warren Buffett once described market-cap-to-GDP as “…probably the best single measure of where valuations stand at any given moment.” The Wilshire 5000 total stock market capitalization relative to gross domestic product (GDP) is HIGHER in January of 2020 than it was during the peak of the 2000 stock bubble.
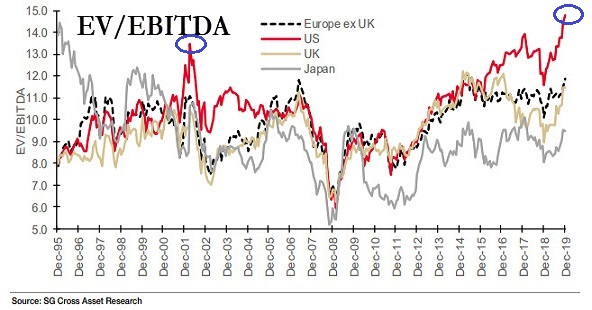
January 18, 2020: The total value of companies (Enterprise Value) in relation to profits (EBITDA) has surpassed the bubble peak from 2000.
January 26, 2020: The S&P 500 clearly sits in the top 5% of historical valuations on at least eight different measures.
The frenzy went parabolic in 2019. Even with an entire calendar year of zero percent earnings growth, stocks surged 30% off the 2018 lows.
And what did the market need to justify the move? A flippity, floppitty central bank that shifted from tightening to easing overnight. Later in 2019, it piled on billions of additional stimulus in the form of quantitative easing (QE).
Even the most recent quarter (Q4 2019) portrays the grotesque particulars of the pre-virus picture. The year-over-year growth? Just 0.62%.
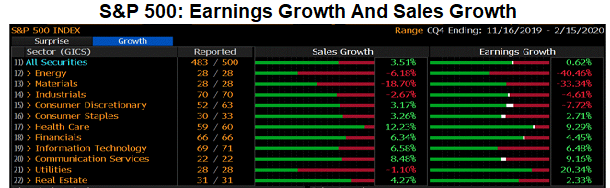
Now, even if you decide to disregard the global manufacturing recession by excluding the Energy and Materials sectors, and even if you offset your questionable decision by stripping away a “positive outlier” in Utilities, the year-over-year earnings growth is anemic. Just 2.8%. Note: Not a whole lot of consumer strength in that Consumer Discretionary segment either (-7.7%).
Again, the data are “pre-virus.” Many models now expect 2020 to be a total disaster as well.
Two entire years of zero percent corporate earnings growth? Investors will be living on a prayer that worldwide central bank stimulus still has the firepower. Otherwise, stocks may indeed unravel 30%, 40% or 50%.
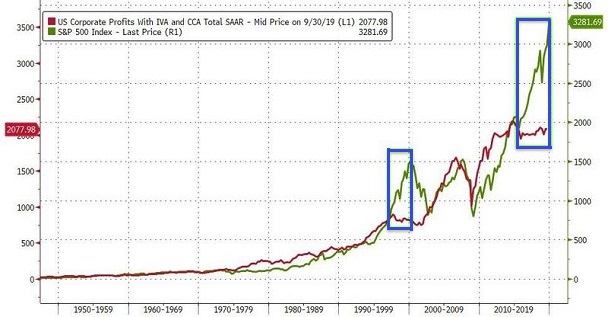
True corporate well-being gets worse when one is looking at profitability as opposed to earnings per share (EPS) craftiness. Corporate profits actually flatlined five years ago. That’s quite similar to what occurred in the late 1990s leading into 2000.
To be fair, it’s not entirely your fault. Why should you have been concerned about a stock bear occurring in 2020 when you had been feeling wealthier? And if nobody on Wall Street was willing to consider an end to the longest U.S. stock bull in history, why should you have gone out on a limb?
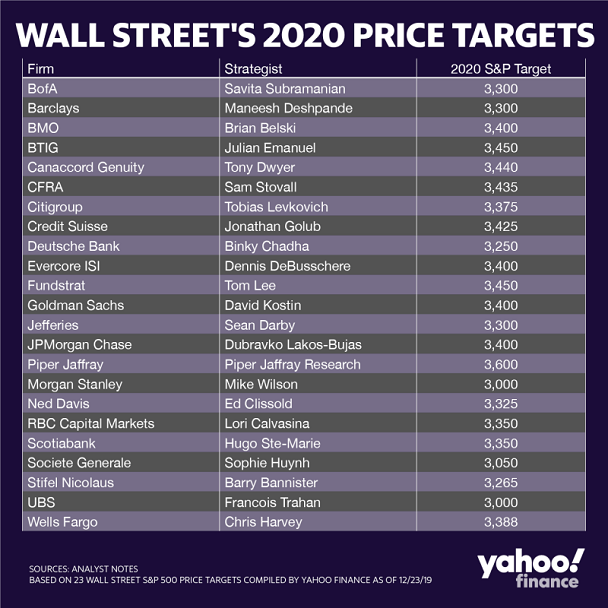
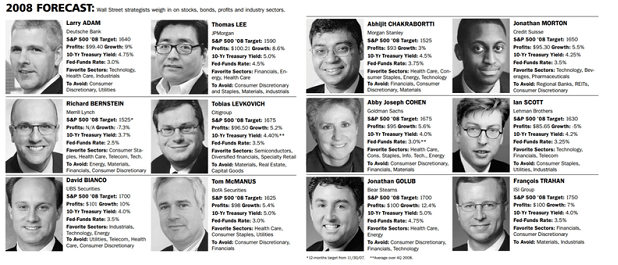
I could suggest that you might have learned from the same mistake you made entering 2008. Though, again, why should you be questioning the visionaries at major banks? (Okay, yes… I said that sarcastically.)
One thing you cannot get around, however, is your refusal to endorse a portfolio protection plan. I know that I’ve been providing you with a variety of ideas.
For instance, I increase Treasury bond exposure and reduce stock allocation slightly when fundamentals become “bubblicious.” More critically, when technical trendlines break, I reduce stock exposure even more.
At my Registered Investment Adviser, Pacific Park Financial, Inc., I reduce stock exposure when the slope of the 10-month moving average (MA) goes negative. And when the monthly close finishes below the 10-month MA, I also reduce stock in client portfolios.
Is it perfect? No. Have I been whipsawed? Sometimes.
That said, I gladly pay the earthquake insurance premium on my home every single year, knowing that I may never get hit by the “big one.” Of course, if I do get devastated by an earthquake, I’d be in a decent position to rebuild.
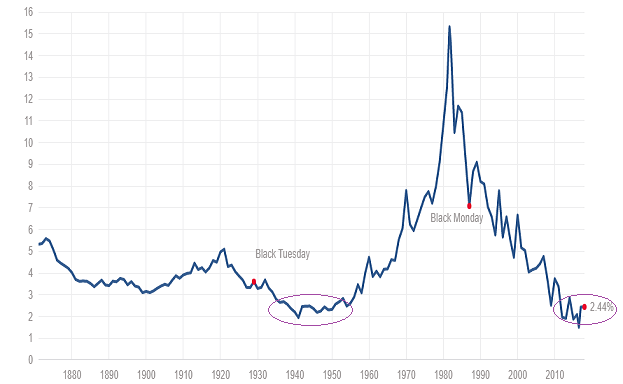
Look at the chart above once more. Maybe you did not reduce stock risk during the 2011 sovereign debt crisis or the 2015-2016 manufacturing downturn/oil catastrophe or the Fed flip-flop in the 4th quarter of 2018.
Nevertheless, the insurance is there to make sure that you don’t lose HALF of your assets in a financial tsunami. Thanks to those little red dots, I sidestepped a great deal of the hardship from the tech wreck (2000) and the financial system collapse (2008).
Maybe you’re hoping that the coronavirus panic will run its course quickly. That is a possibility. Then again, hope is the furthest thing from a strategy.
Those who were hoping in 2007 seriously underestimated the impact of subprime mortgages. Similarly, those who were hoping in 1999 surely believed that the “New Economy” had altered the way to value stocks.
It follows that you may have already fallen for the notion that ultra-low interest rates justify exorbitant stock prices. They didn’t justify ridiculous stock premiums for the 20 years between 1935 and 1954. And they don’t now.
Truthfully, the 2020 stock bubble is in serious trouble. Here are several telltale signs:
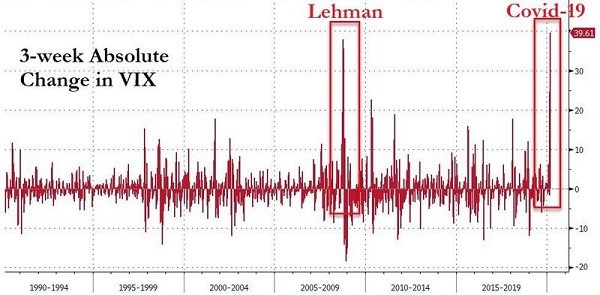
(1) The CBOE’s VIX Volatility Index recently rocketed in ways that few could have imagined.
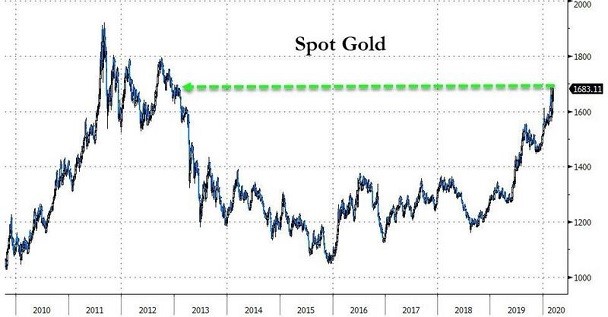
(2) A zero-percent yielding precious metal has broken out to multi-year highs.
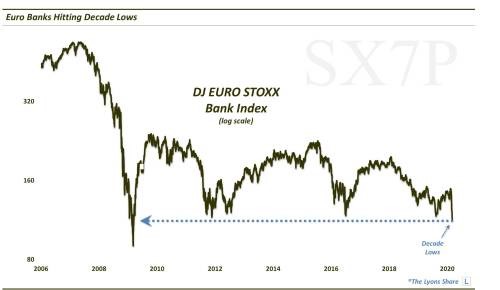
(3) Due in large part to excessive junk bond exposure as well as exposure to negative yielding bonds, stock shares of foreign banks have fallen to levels not seen since 2008-2009’s systemic breakdown.
(4) According to Bloomberg, a derivatives index (Markit’s CDX Investment Grade) that measures the perceived risk of corporate credit rocketed more on Friday (3/6/20) than at any point since 2011’s sovereign debt crisis.

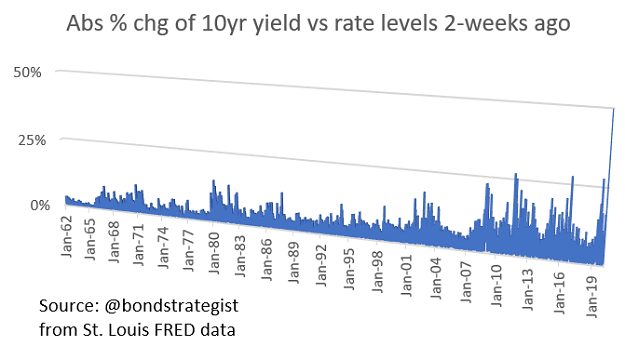
(5) There had never been a time in history when the absolute level of 10-year yields moved 50% over a two-week period, until now. From 1.5% to 0.75%.
I know, I know. You still think the Fed can magically turn this whole thing around.
Unfortunately, the Fed probably cannot get back to zero percent rates and kick-start a massive increase in electronic money printing fast enough. They’ve likely lost control.
I showed the pattern below in earlier articles. When the Fed went neutral. When the Fed cut 25 basis points. And then another. And then another.
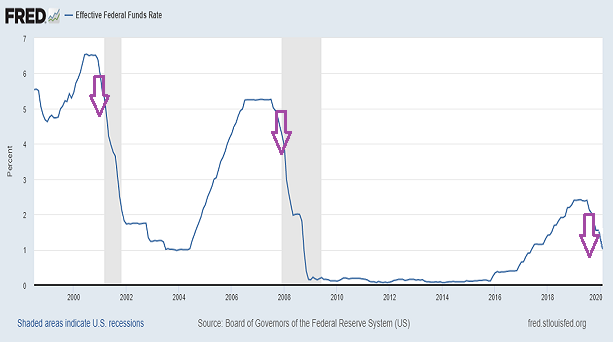
Blame it on the coronavirus, if you must. It will not change the fact that the economy peaked in the 3rd quarter of 2018.
That’s why the Fed ended its tightening campaign prematurely in the 4th quarter of 2018. That’s why the central bank went on to cut overnight lending rates three times in 2019. That’s why they added hundreds of billions of dollars of quantitative easing (QE) liquidity in the 4th quarter of 2019. And that’s why the overnight lending rate (EFFR) is now down at the 1.0% level.
These are all signs that the stock bubble has a whole lot of holes to patch. I do not think the Fed can get ahead of it. I do think the wealth effect is more likely to significantly reverse itself before the economic fallout from COVID-19 subsides.
It is true that my commentary since 2015 has often sounded bearish. However, believing that the Fed is unabashedly blowing a third asset bubble and showing the evidence of that bubble was not synonymous with a bearish investing stance. (Certainly not for trend-followers.)
Keep in mind, I do not short equities. And our allocations are always “long.”
Granted, there have been times when there’d be less at stake in the allocation. There would also be periods when we incorporated “diversfiers” or multi-asset stock hedges (e.g., Treasury bonds, muni bonds, gold, cash equivalents, etc.).
It follows that warning about the reality of a stock bubble was never about my bearishness. Rather, it was always about the ridiculously absurd bullishness in stock-land.
The good news? You can reexamine the facts about the current stock bubble. And even if you decide to ride out the storm without changing a thing, at least you will be fully informed.