How ludicrous are current stock prices? Consider the following charts:
(1) Traditional Indicators. Four prominent measures — PE10, Crestmont PE, Q Ratio, Regression — have collectively catapulted more than 3 standard deviations above a mean. The average of the four (172%) has even eclipsed 2000’s infamous stock bubble (164%).
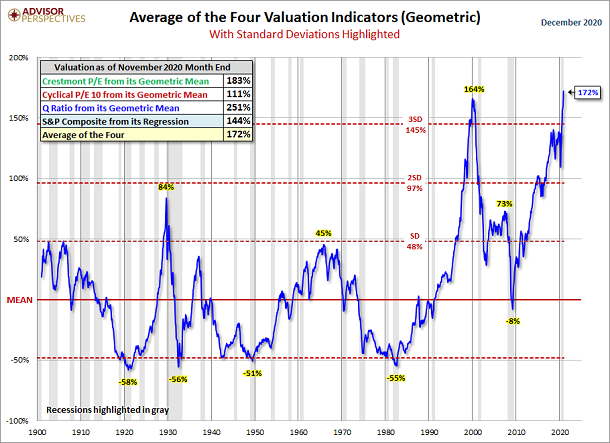
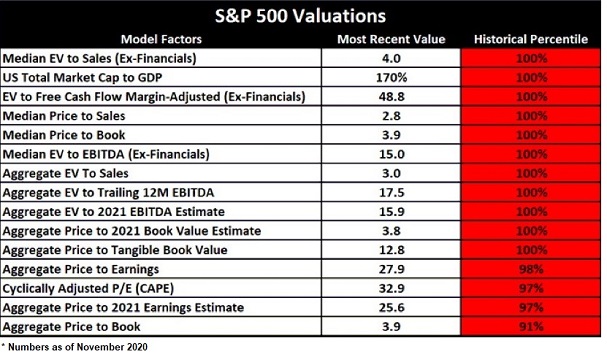
And that’s not all. Nearly every traditional measure is sitting at the highest valuation levels in U.S. history.
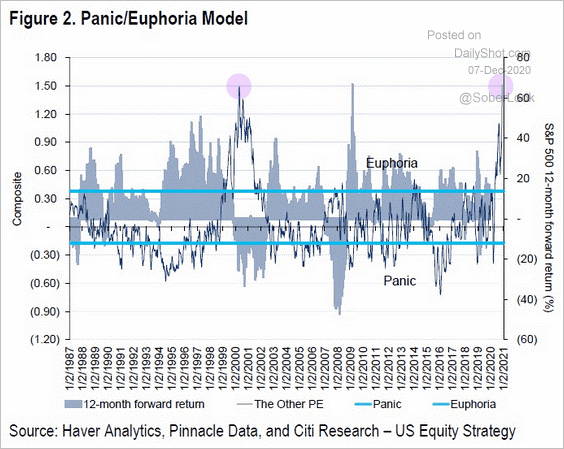
(2) Citigroup’s Panic-Euphoria Indicator. This measure combines a host of greed-fear indicators, including options trading, margin debt as well as bull-bear sentiment. Once again, investors haven’t been this “cuckoo for Cocoa Puffs” since the dot-com tech bubble burst in 2000.
(3) Theory of Relativity. When investors are inclined to speculate, they tend to chase growth stocks. When investors are looking for beaten-down bargains, they tend to focus on undervalued stocks for the longer-term. Today? What investors are paying for growth stocks versus what they’re paying for value stocks is eerily reminiscent of 2000’s stock bubble.
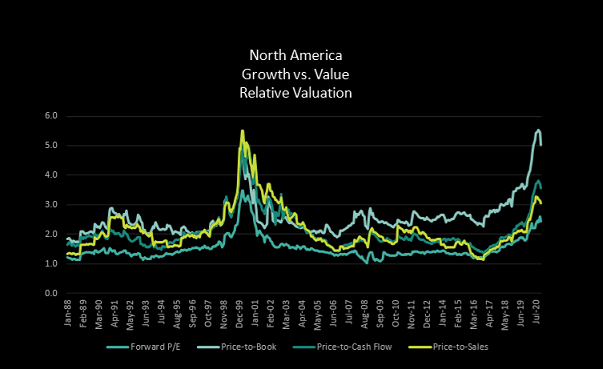
Nearly everywhere one looks, the absurdity of stock pricing in 2020 rhymes with what occurred just 20 years ago. Yet participants remain unfazed.
Is this time actually different?
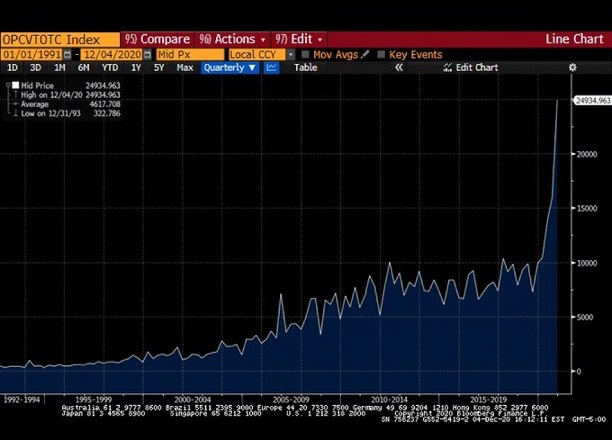
Let’s take a look at call option demand. Investors buy calls when they expect stock prices to rise. Similarly, sellers of call options often cover positions by buying underlying stocks, putting additional upward pressure on price.
To what extent are folks betting on prices to keep increasing? Today’s speculative folly is far more extreme than 2000’s irrational exuberance.
Would you like to receive our weekly newsletter on the stock bubble? Click here.