
Can trillions of Fed liquidity overcome the probability of a deluge in corporate insolvencies? Fed Chairman Jerome Powell just acknowledged that additional government fiscal stimulus, not Fed stimulus, may be the only way to lessen this pain.
“The passage of time is really all it takes to turn a liquidity problem into a solvency problem,” Mr. Powell explained. “We’ll be a big help for companies for a while, but over a longer period of time, it may be that more fiscal help is needed.”
I elaborated on the distinction between Fed liquidity and corporate insolvency several weeks ago. (See April’s Rally: ‘Inappropriately Positive.’) In that commentary, I also echoed comments by billionaire investor Howard Marks. He said, “We’re only down 15% from the all-time high… the world is more than 15% screwed up.”
Yet here we still are. The S&P 500 is only down 16.7% from a record high. Meanwhile, the Nasdaq’s bounce off the bear market lows has brought it back to ‘flat-ish’ for the 2020 calendar year.
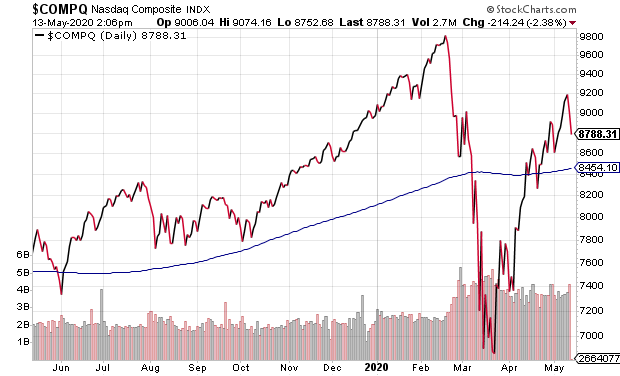
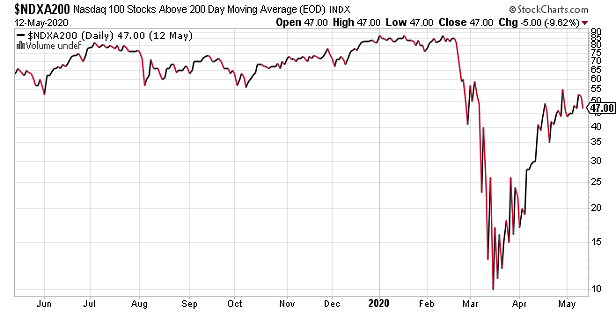
Still, even the Nasdaq is not as strong as people suspect. More than half of its component companies are in a long-term downtrend. (Only 47% are currently above a respective 200-day moving average as of May 12. The percentage has dropped further here on May 13.)
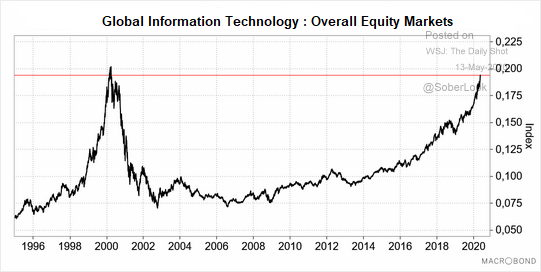
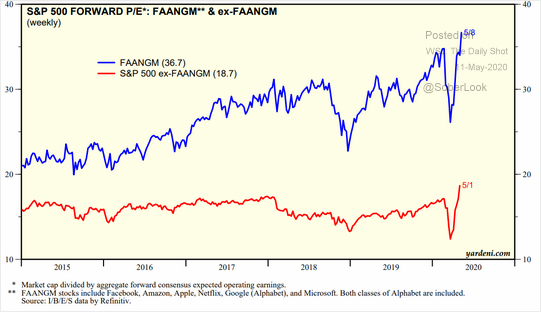
Moreover, the relative performance of global information technology versus all other equities is decidedly reminiscent of the 2000 tech bubble. Then, like now, there was a “New Economy” paradigm shift. (It still did not mean that buying a piece of the future at exorbitant prices made investment sense.)
Focusing solely on the supposed ‘Next Normal’ for the economy – e-commerce, life sciences, work-from-home winners — is myopic. There are far too many countries around the world that still rely on the well-being of a wide variety of older school industries.
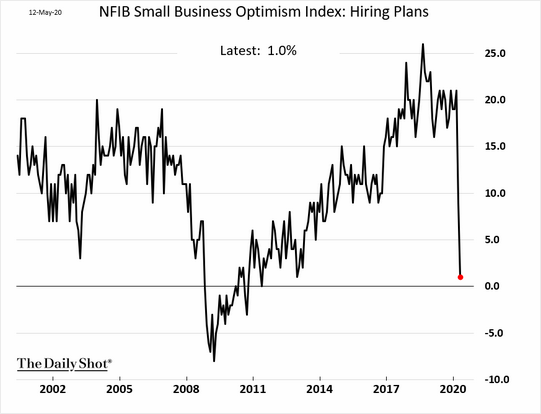
Is it really the case that entire economic segments can be beaten with an ugly stick, while tech or biotech or fintech or whatever-tech will remain unharmed? Not in an economy where unemployment persists for longer than anticipated and small businesses struggle to put the pieces back together. Consumption by households and by small business has little chance of snapping back quickly.
Hiring by small business will be weak…
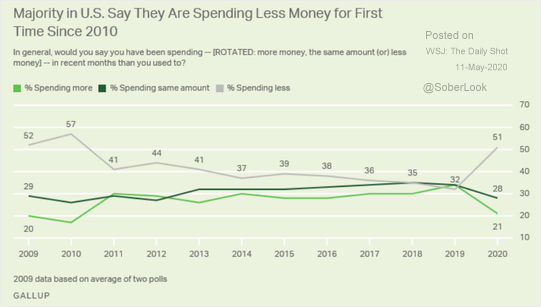
…and consumers will spend less.
Unlike 2016, when energy bondholders worried that scores of oil companies would go belly up, the insolvency wave in 2020-2021 will spare few industries. Brick-n-mortar retail, hospitality/tourism, basic materials, energy, lending/banking/insuring, commercial real estate, auto, restaurants, sports/leisure, airlines, transporters. Fed liquidity and tech stock speculation will not be sufficient to save questionable corporations across multiple economic segments.
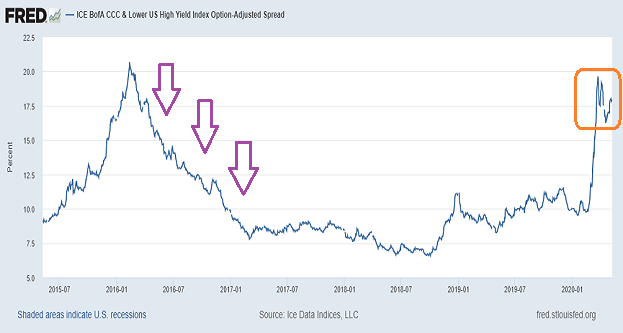
It is worth noting that CCC junk bond spreads remain elevated. Again, this not like 2016. Present-day circumstances are suggesting that the U.S. economy will need to work through an insolvency phase.
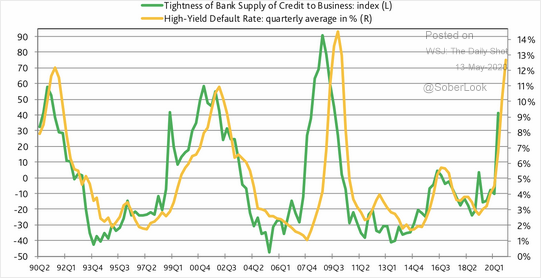
Also, banks have tightened up credit considerably. How does that play itself out? Scores of corporate defaults.
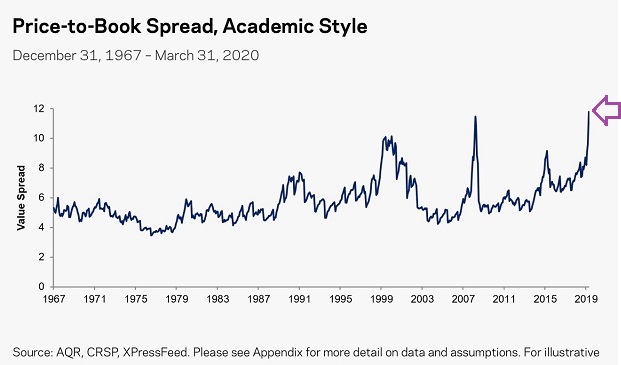
Granted, speculators may continue to push stocks higher, defying economic rationale. Yet even stock investors may begin to wonder about the price they are currently paying for the broader S&P 500 relative to “book value.” The highest price-to-book (P/B) in market history is one more sign of poor risk-reward prospects.
Even for those putting their faith in Forward P/Es, where there is very little visibility 12 months out, mega-cap tech is more than a little pricey. It is a whole lot of pricey.
In last week’s commentary, Stocks Vs. Real Life, I provided a general overview of our bear market allocation for moderate growth-n-income clients. The individual stocks like Abbvie (ABBV) and stock ETFs like Vanguard Megacap (MGC). The income holdings like Digital Realty Trust Preferred (DLR-I). And the 33% that we’ve allocated to 0%-0.25% yielding T-bills/cash.
Far too often, people denigrate the temporary holding of a large cash position. On the flip side, Warren Buffett himself is sitting on $140 billion in cash (33% of Berkshire Hathaway’s $420B market cap). That’s the largest percentage of cash relative to the value of Berkshire’s holdings and Berkshire’s market cap in the history of Berkshire Hathaway.
Why? Buffett explained at his annual shareholder event that he cannot find a decent price for anything. Not a darn thing.
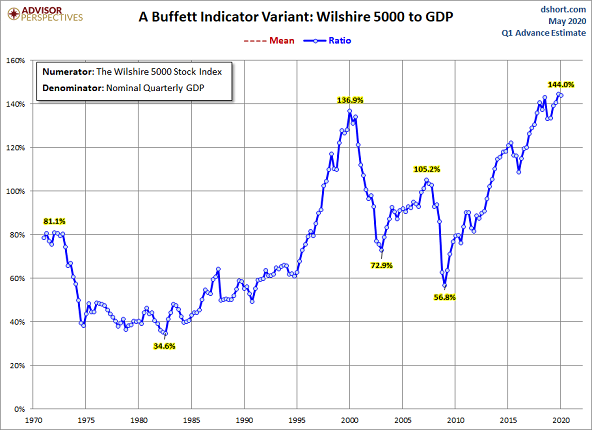
Perhaps the Oracle of Omaha pays attention to the valuation indicator that he himself described as “…the best single measure of where valuations stand at any given moment.” The market-cap-to-GDP indicator, or Buffett Indicator, is higher than it was at the 2000 peak.
Even if one ignores the overvaluation in current P/Es, forward P/Es, price-to-book (P/B), price-to-sales (P/S) and market-cap-to-GDP, Fed depression-level monetary stimulus has not convinced Mr. Buffett to put his cash hoard to work. Right now, he prefers the optionality of cash.
Specifically, he views his cash position as a call option without an expiration date or a strike price. The value of that cash is what it can earn when he can acquire stocks (and other risk assets) at bargain prices.
It may be tempting to think of cash as a non-earner. Yet I much prefer to regard cash in terms of what it can do for me when I wish to exercise my option to scoop up inexpensive risk assets.
Would you like to receive our weekly newsletter on the stock bubble? Click here.