
One can decide to chase a stock bubble for the potential windfall. Yet only investors with sell disciplines have any chance of coming out unscathed.
Consider the relationship between growth stocks and value stocks. Over time, one tends to receive more affection than the other. Yet valuation differences tend to vacillate around an average difference.
During stock bubbles, however, the crowd completely dismisses bargains in a fanciful pursuit of fast-growing innovators. In fact, one of the telltale signs of 2000’s tech bubble was a valuation difference that had eclipsed three standard deviations. (See chart below.)
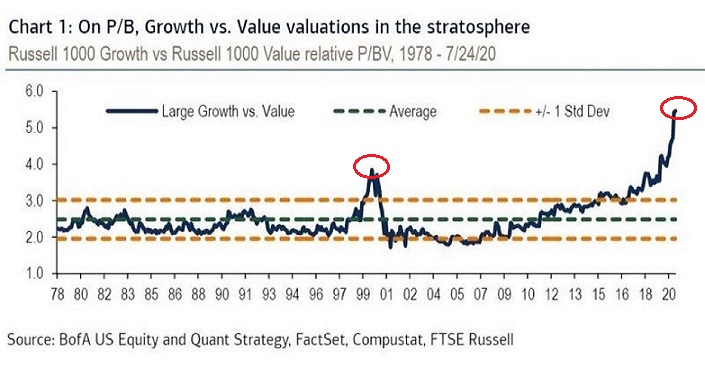
Now get a gander at what has happened in 2020. We’re not just talking about a three-standard-deviation period that occurs about 1% of the time. Nearly six standard deviations away from the average valuation difference between growth and value is borderline bonkers.
There’s more.
In normal times, investors consider how much they are willing to pay for the revenue that corporations can generate. The multiple tends to be between 1.0 and 2.0.
For many, the dot-com balloon was “obvious” with the price-to-sales barometer hurdling the 2.0 level. Right now? The S&P 500 is trading at an astronomical P/S ratio of 2.67.
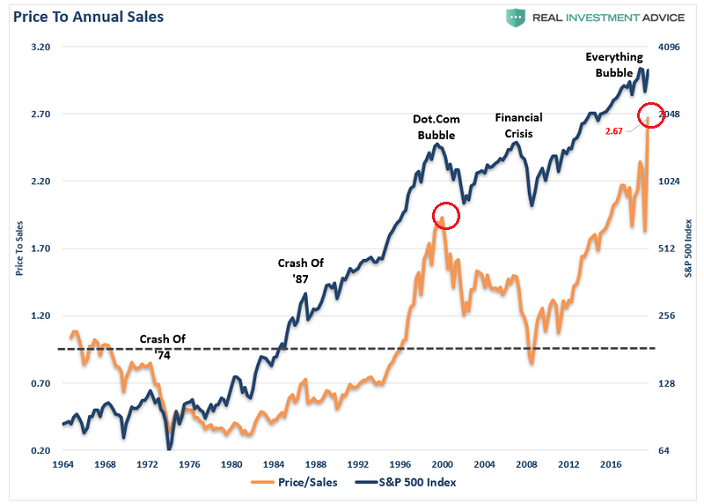
Profits, sales, book value, cash flow. Irrational euphoria fueled by the money printing Federal Reserve has nullified important indicators of corporate well-being.
Chase the bubble if you must. Just have a plan for when it bursts.
Would you like to receive our weekly newsletter on the stock bubble? Click here.