Central banks like the Federal Reserve have, for the most part, fired all their monetary stimulus bullets. Zero percent rate policy (ZIRP). Shock-and-awe asset purchasing with hundreds of billions in electronic dollar credits (a.k.a. “QE” or “quantitative easing”).
Governments like the U.S. government are trying to cobble together fiscal stimulus in the form of everything from bailouts, targeted loans, cash payments and tax breaks. Analysts are trying to determine whether $1 trillion in fiscal stimulus would even do the trick.
The problems include three simultaneous jolts:
From a demand perspective, quarantining is taking place on a worldwide scale, limiting travel and consumption. From hotels to airlines, bars to restaurants, department stores to Mom-n-Pop retailers, cash flow is drying up.
From a supply perspective, countries that manufacture goods and/or transport them are unable to do so. The adverse effect on U.S. businesses that rely on overseas production is difficult to quantify.
Perhaps the worst tremor of them all? The financial one. Stock, bond, currency and commodity markets have kicked the wealth effect reversal into gear.
As I discussed on many occasions, 21st century recessions do not cause wealth effect reversals. On the contrary. Wealth effect reversals cause 21st century recessions.
With a tool kit that I have employed for nearly 30 years, coupled with the premise of Fed-inspired wealth effect creation and wealth effect reversal, insulating client portfolios has been relatively straightforward. During the 2000-2002 tech wreck. During the 2008 real estate-related subprime disaster. And in the virus pricking of the current asset bubble.
Before I lay out how we limited the 2020 bear market destruction, let me take you back to my personal introduction to stock mayhem. Back when I lived in the Republic of China (a.k.a. “Taiwan.”)
In 1986 and 1987, Taiwan had been one of the fastest appreciating stock markets in the world. They had just opened Taiwanese markets to foreign money investment.
It was truly a phenomenal time to be “in the business”. I had been teaching financial concepts in English as well writing financial newsletters in English.
Then came October 1987 in the U.S. I was only 20 years old when the U.S. stock market plummeted nearly 20% in a single trading session. And it was famously dubbed, “Black Monday.”
The impact of the 1987 crash stateside immediately rolled over into Taiwan’s stock market. And Taiwan, where far too much money had been chasing big gains in a recently opened marketplace, witnessed its asset bubble explode in remarkable fashion.
There and then, I rallied around a mathematical notion about compounding. Specifically, one cannot compound money over time unless one participates in markets on the way up and minimizes losses on the way down. (Notice that I didn’t say eliminate losses.)
Fast forward to the present-day asset bubble.
Our first layer of protection may have been subtle, but it was very effective in the long run. Over the last five years – yes, five years since the Fed ended its liquidity enhancing/money printing balance sheet expansion – we reduced our overall allocation to equity and we reduced the nature of the allocation.
The best example that I can give is for “balanced investors” in our near-retiree/retiree client base who might otherwise have been 60%-70% widely diversified growth and 30%-40% in widely diversified income. At that time, with overvaluation in stock as well as tight credit spreads in high yield, we shifted to 50%-60% large-cap U.S. stock only and 30%-40% in investment grade credit only. (Some cash had been raised as “dry powder.”)
Despite a decidedly negative tone in my commentary, the nature of the risk had changed more than anything else. We were no longer willing to yield hunt when bonds should be safer havens. And we were no longer willing to stay at the top of our target range with smaller companies and foreign companies, where true profitability and risk-adjusted performance had been waning.
With 100,000 followers across a variety of financial media platforms, the social media critics had been plentiful. The good ones pointed out that the Tax Cuts and Jobs Act of 2017 had extended the business cycle. And it did. For a little while. The bad ones (a.k.a. “basement dwellers” or “trolls”) simply bragged about buying every 1% dip. Never mind the fact that they were supposedly 100% long and did not have cash to buy dips. Never mind the wise cracking about the supposed opportunity cost that I was missing out on.
Keep in mind, we never failed to participate in meaningful fashion. The significant, risk-adjusted large-cap outperformance over small caps and foreign stocks made up for the slight pullback in overall equity risk for near-retirees/retirees.
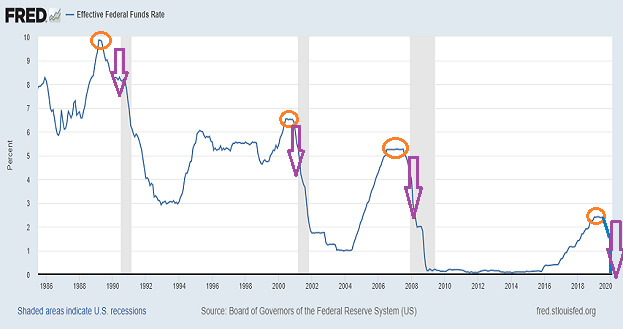
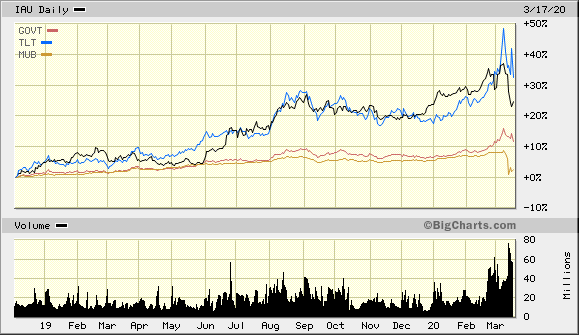
By November-December 2018, when the inverted yield curve all but insured Fed capitulation, credit quality became paramount. For example, in some cases, we picked up iShares 20-Year Treasury (TLT). In others, we increased exposure to iShares US Treasuries (GOVT) and/or iShares National Muni Bonds (MUB). In other cases, we swapped certain assets for iShares Gold (IAU).
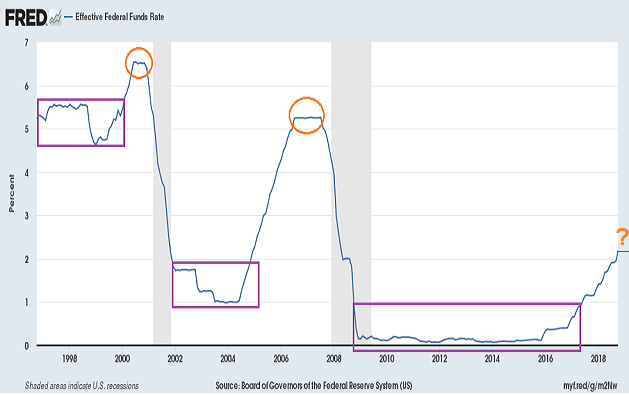
The Fed had gone neutral. And we understood that neutrality would give way to rate cuts and an eventual return to the zero bound. Assets like TLT, GOVT, MUB and IAU mattered to us.
How have they done since? You can probably guess.
Our first step of a tactical allocation shift occurred many years earlier. Our second step occurred with the inversion of the yield curve and the Fed flip-flop in Q4 of 2018.
Yet these allocation shifts had been based on fundamental valuation and/or macro-econ indications. The next big shift would need to depend upon trend-following and market internals.
If you’ve read my commentary in the past, then you already know one of my favorites. Its track record has shown risk-adjusted outperformance of buy-n-hold over 90 years, 30 years and significant investing periods.
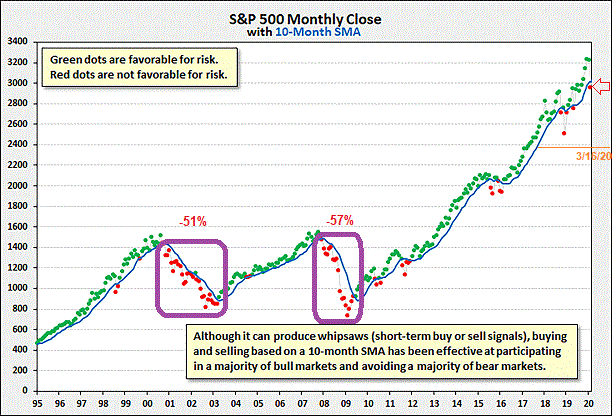
And you don’t have to take my word for it. Meb Faber of MebFaberResearch.com and The Idea Farm conducted the research that empirically demonstrates the risk-adjusted efficacy of the monthly close on the 10-month SMA. Those who are interested can review the research specifics at this link.
In other words, if you incorporate trend-following into your tactical asset allocation, you’re not a perma-bear. You’re not shorting the market. You value the importance of losing less in times of bear market decimation. Like 2000. Like 2008. Like 2020.
It is worth noting that our risk-reduction methodology is not confined to the monthly close. We use the slope of the 10-month SMA, the NYSE Advance-Decline Line, credit spreads and a variety of market internals. Each provided us with signals that determine when to reduce or raise risk.
Remember our example of the high target of risk for those who may have been 60%-70% in widely diversified growth and 30%-40% in widely diversified income? With the indicators that I mentioned above, most of these folks are down to 30% large-cap equity alone, 30% high quality credit, 35% cash equivalents and 5% gold. And most of that came prior to the madness of March.
We have also executed a number of trades where we found it beneficial to sell into strength and/or buy into weakness. March volatility made it possible to get our allocation right where we wanted it.
What does that look like on the stock side? For the equity, some ETFs that represent mega-caps and dividend growth. Assets such as Vanguard MegaCap (MGC), Nasdaq 100 (QQQ) and Vanguard Dividend Growth (VIG).
We also went into the 2020 stock bubble with the belief that Defined Outcome ETFs like Innovator Power Buffer ETF (PJAN) offered a way to hedge some of the stock risk in an election year and slowing economy. Is it down? Sure. Yet -17% or -18% year-to-date as I type is not looking quite as bad as -28%.
(Note: The returns may look a whole lot better for PJAN when the entire year plays itself out, especially as it relates to the 15% downside buffer. We shall see.)
What’s more, we have a select few individual stocks. I have talked about them throughout the year. Johnson and Johnson (JNJ). Gilead (GILD). Digital Realty Trust (DLR). Even some Pepsi (PEP).
Were the tactical asset allocation moves perfect? No. Are clients still worried about losing money? Of course.
Yet the alternative? Buy-n-hold-n-hope?
Practically speaking, Americans tend to buy high on equanimity and greed, while they tend to sell low on volatility and fear. Research demonstrates that few can stick with holding a predefined asset allocation mix through thin and thick.
So yes, tactical asset allocation is a better choice. Especially in an undeniable stock bubble. Especially with a Fed that could not see the forest for the trees.
This time was never going to be different.