A little too parabolic. (Yeah, I really do think.)
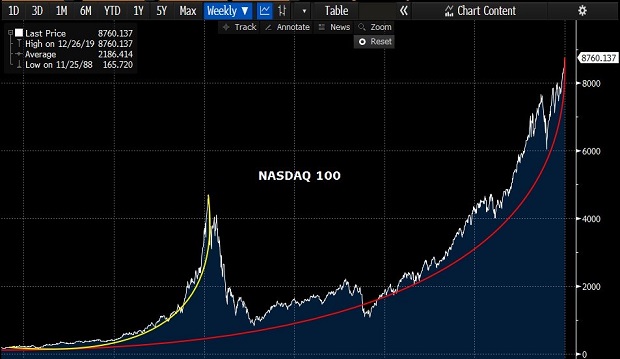
Parabolic moves for the tech sector have never ended well for the stock market. In the first chart, the yellow line show what transpired for the Nasdaq 100 as 2000 approached, as well as the aftermath. The red line shows the same parabolic move heading into 2020.
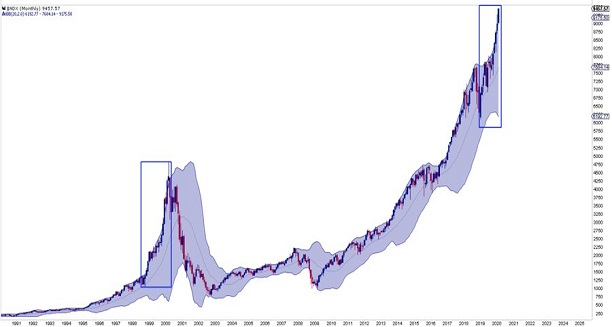
In the second chart, we can see the extraordinary deviation above the trendline for the Nasdaq 100 – both in 2000 and 2020. Ludicrous parabolic moves above technical trends and Bollinger bands have typically reversed themselves in ugly fashion.