Is the stock bubble making investors wealthy? Temporarily.
Consider household equity exposure relative to disposable personal income. Investors have more skin in the equity game than they ever have before. What that means is that, with the S&P 500 sitting atop a record peak, participants are “wealthier” than ever.
On the flip side, household equity exposure relative to disposable personal income has completely detached from its long-term exponential growth trend. It rivals the deviation that occurred prior to 2000’s tech wreck; it rivals the deviation that transpired during the 2008 financial crisis.
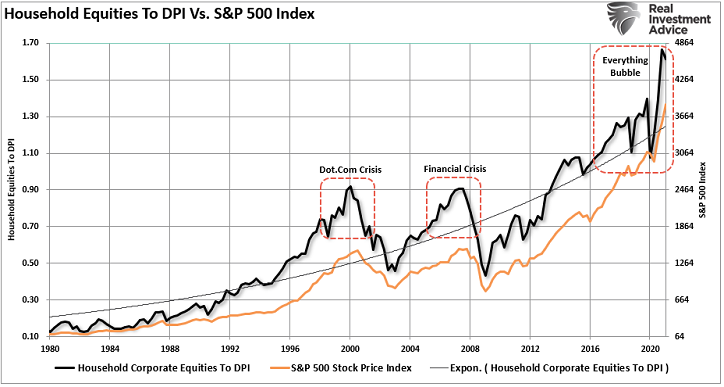
The implication here is that newfound household wealth may ultimately prove transitory. When the stock bubble bursts, there are scores of hold-n-hopers who will end up holding the proverbial bag.
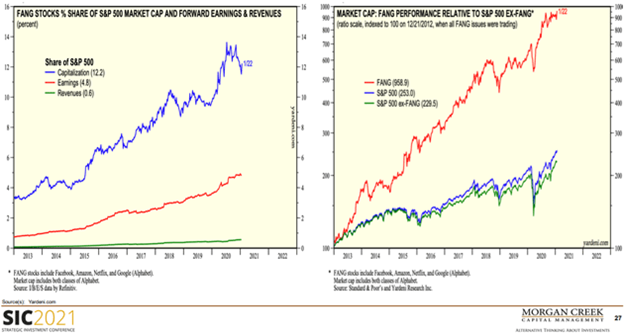
Think about it. Few investors can imagine a scenario where stalwarts like Facebook, Amazon, Netflix, and Google/Alphabet (FANG) lose HALF of their value. If history is any guide, however, 50% bearish losses represent conservative estimates.
It is worth noting that FANG stocks account for less than 1% of the S&P 500’s sales revenue and less than 5% of the S&P 500’s earnings. Yet these four companies represent 12.2% of the S&P 500’s market capitalization.
What’s more, FANG stocks have collectively quadrupled the S&P 500’s performance since 2012. A reversion to the mean could be particularly brutal for the popular mega-caps.
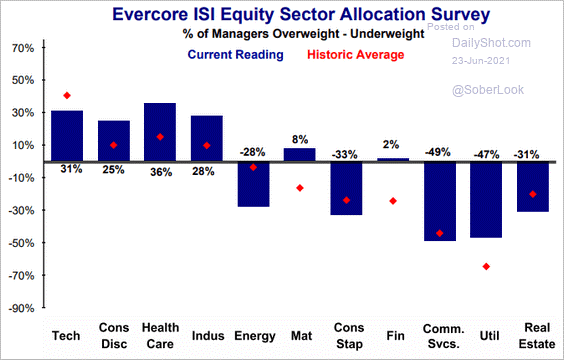
Overallocation is only part of the problem. Another part? Participants continue to load up on the mo-mo tech sector and the go-go consumer discretionary segment. And they are doing so at a time when stock valuations have rarely been so nutty.
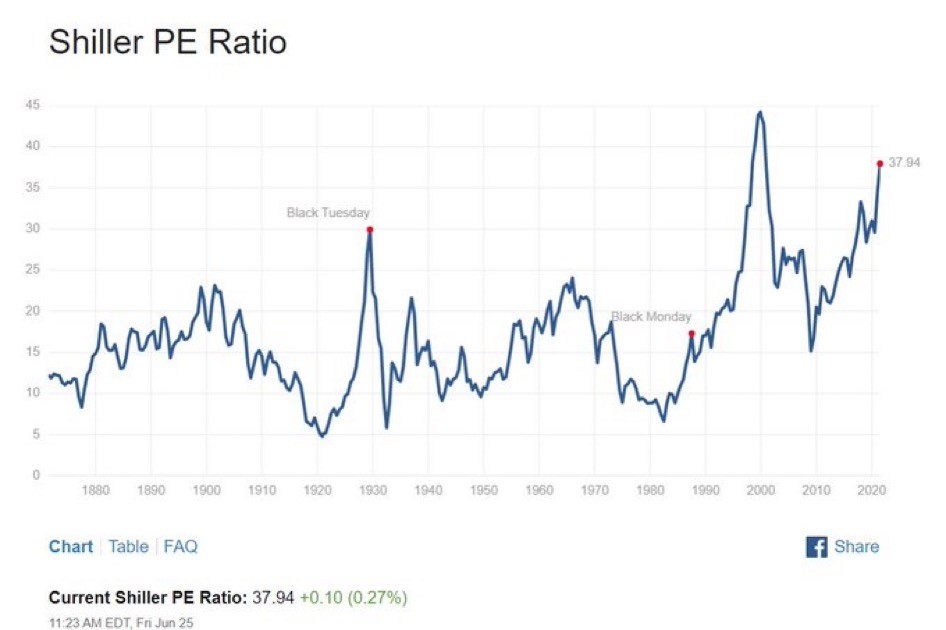
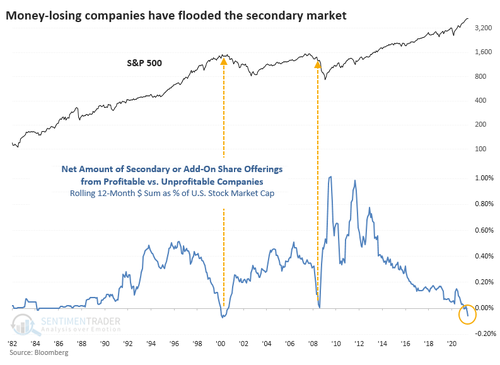
Keep in mind, frothiness is evident in sentiment/technical analysis as well. For instance, according to SentimenTrader, the total amount of new shares that have come to market over the past 12 months is roughly $27 billion. That is a record.
Even more noteworthy? 748 unprofitable companies issued secondary or additional shares, while a mere 254 profitable companies did the same.
When have money-losing entities fared so well with the investing public? Right before the 2000 tech bubble exploded and right in the middle of the 2008 financial crisis.
SentimenTrader goes further. The technical analysts note that the percentage of S&P 500 constituents above respective 50-day moving averages plunged last week, while the majority remained above 200-day averages. In recent trading sessions, however, with the S&P 500 logging new high after new high, the percentage of S&P 500 members above the 50-day hardly moved.
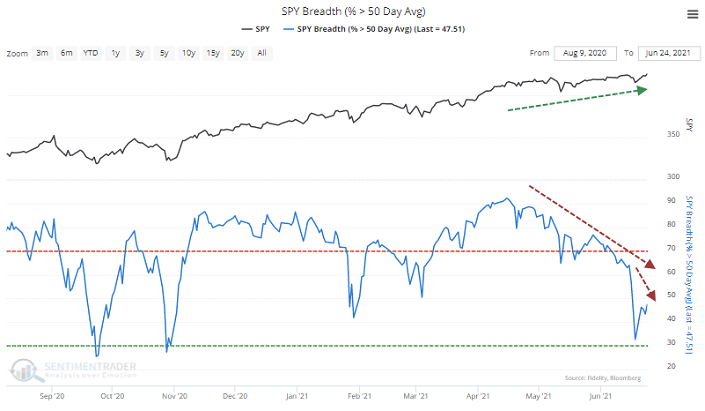
Over 93 years of historical data, this particular divergence resulted in declines every time. And some of the price declines were downright devastating.
It happened in 1929, 1959, 1963, 1972, 1998, and 1999. Those include some fairly infamous bear markets.
Perhaps Federal Reserve monetary policy can backstop stocks under any scenario. Severe inflation. Virus variants. An unforeseen crisis.
Of course, should faith in the Fed falter, there’s little else to sustain stocks at an elevated plateau. Those who did not have a process for lowering risk before a rapid-fire descent could get their coattails stuck in the exit door.
Would you like to receive our weekly newsletter on the stock bubble? Click here.