
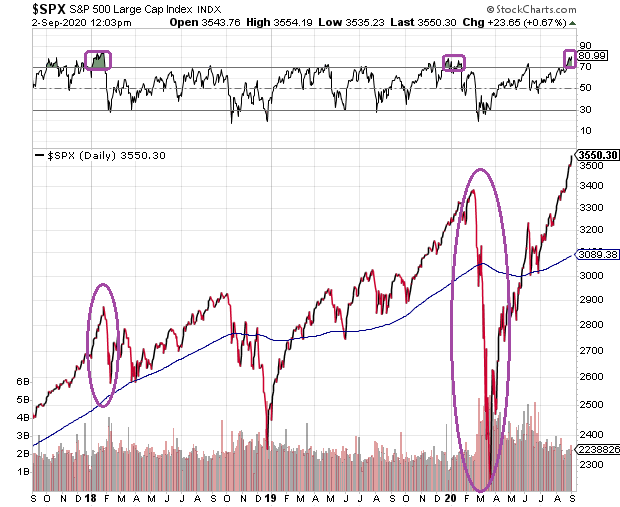
Extended periods of overbought conditions in relative strength (RSI) typically lead to market pullbacks. Equally telling? The RSI for the S&P 500 has hit 81 — a relatively rare feat in and of itself.
In a similar vein, at 3567, the S&P 500 is trading 15% above its 200-day long-term moving average. This type of overreach has occurred in only 0.2% of the trading sessions over the past 85 years.
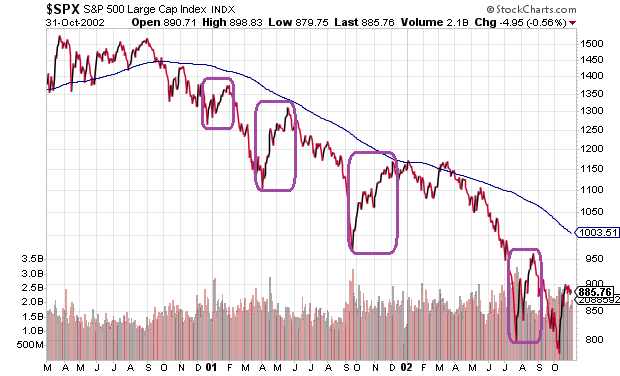
Ultra-euphoric speculation also exists in the options pit. For example, the 5-day put/call ratio for stocks is at a ridiculous low of 0.40. The last time that interest in “puts” had dropped this far relative to interest in “calls?” You’d have to revisit January of 2001.
Back then, “hope rallies” were quite common. Unfortunately, at the start of 2001, the stock bear brutality was just getting underway.
At what point will market participants begin to question the most extreme valuations in the history of U.S. stocks? When might the investment community determine that the 2020 stock bubble sits atop the same lunatic fringe as its 2000 predecessor? Only time will tell.
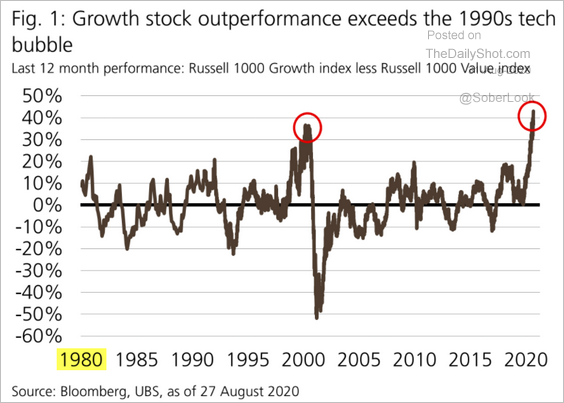
At the very least, one might anticipate an eventual shift out of go-go growth into more reasonable bargains at the value camp. The disparity between growth and value has already surpassed the late 1990s tech craze.
Would you like to receive our weekly newsletter on the stock bubble? Click here.