
It was the worst of times, it was the best of times.
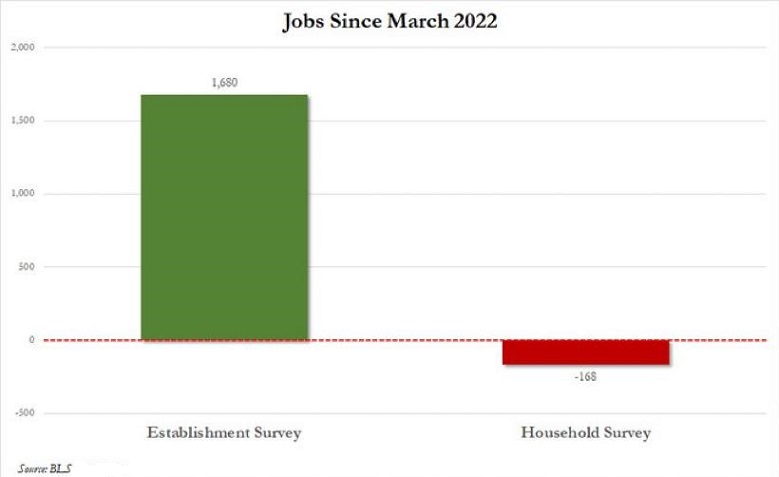
On Friday, the Bureau of Labor Statistics (BLS) revealed that the country created more than 500,000 jobs in July. Equally terrific? The data show gains of nearly 1.7 million new positions in just 5 months.
Surprisingly, the very same BLS publishes a household survey on job creation. The result? A net loss of more than 100,000 positions in the five month period since March.
The mainstream financial media outlets focus only on the more favorable survey. Yet it might be worth discussing how the same government entity came up with such vastly different results.
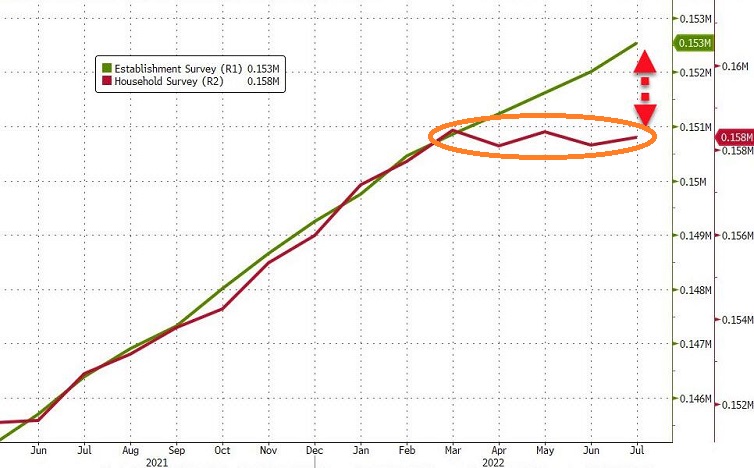
One explanation? People work multiple jobs, and the Establishment Survey counts each of those positions as unique.
Another feature of the more widely cited Establishment Survey was the notion that unemployment dropped to 3.5% from 3.6%. The figure represents a multi-decade low.
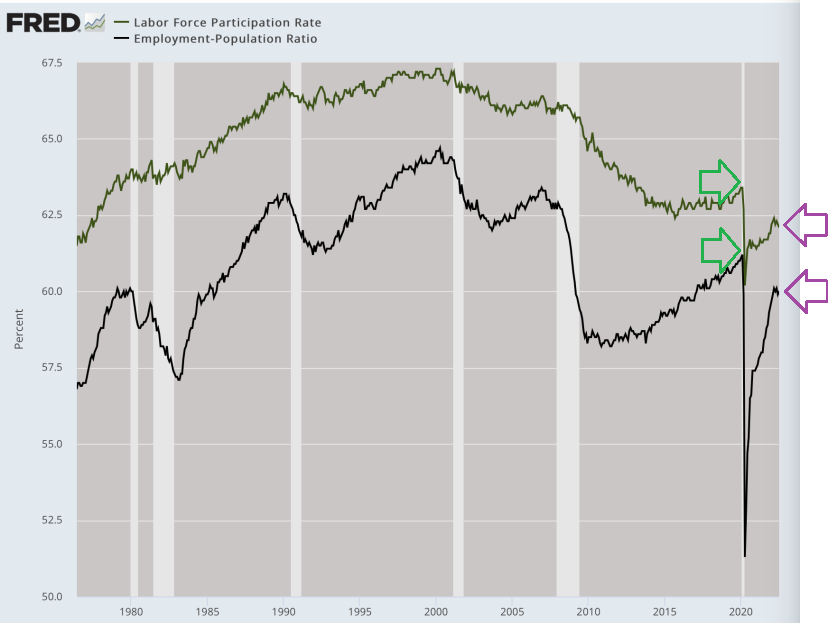
However, more than a million workers have not returned to the workforce since the pandemic. This is clear from both the labor force participation rate and from the employment-population ratio.
In other words, the widely cited 3.5% unemployment rate is decidedly misleading.
Similarly, few seem to talk about the uptick in unemployment claims.
There is also the problem that workers are falling further behind. In particular, one would have to travel back in time many decades to find a period when inflation-adjusted earnings for employees were as negative as they are right now.
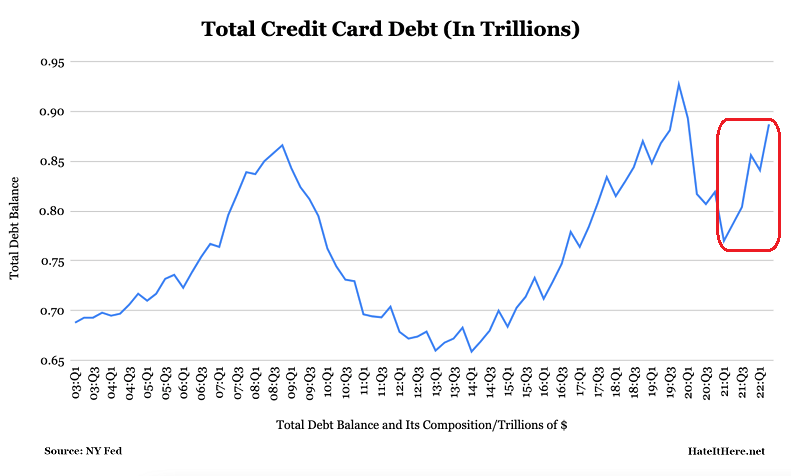
More disturbing? Households are forced to deploy credit card debt to get by.
For instance, total credit card debt rose to $890 billion, representing a 13% year-over-year leap. That is the quickest increase in more than 20 years.
And it’s not just BLS job data that has been incongruent.
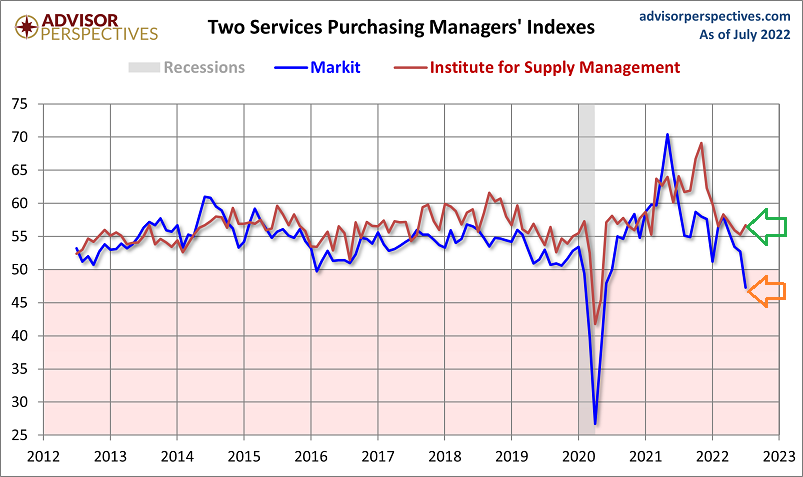
Consider our service economy measures — the ISM’s Services Index and Markit’s Services Index. One is pointing to healthy expansion, while the other is showing definitive contraction.
How can data be so wildly different?
At the moment then, a sensible base case would point to stagflation. In particular, growth is mixed and inflation is high. (Inflation may still be rising.)
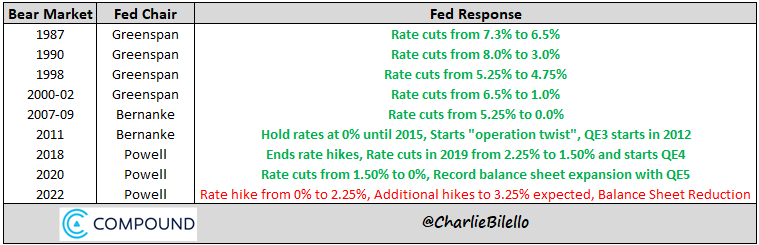
In this environment, the Federal Reserve has chosen to continue tightening. That does not usually happen when major indexes have fallen 20% or more from the top.
With the Fed aggressively reducing its balance sheet as well as raising its overnight lending rate, one might think the stock bubble would take a rest. Yet it keeps rising off the June lows.
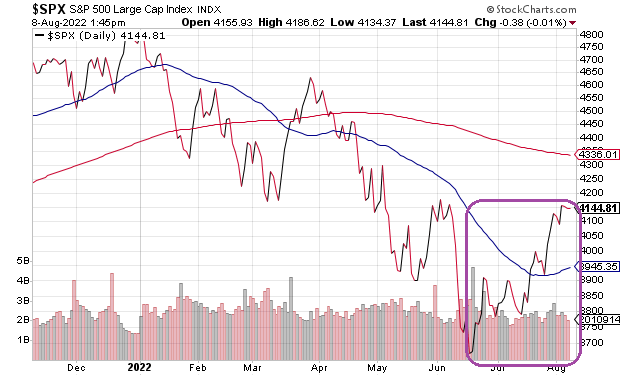
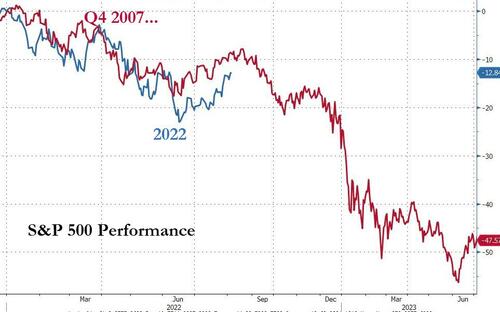
Perhaps ironically, the bounce may be the least crazy aspect of the stagflationary particulars here in 2022. The same thing happened during the last true stock bear (11/07-3/09) — right before all heck broke loose.
Would you like to receive our weekly newsletter on the stock bubble? Click here.