
When it comes to understanding the wackiness of the 2020 stock bubble, it may be instructive to look at valuation indicators that correlate highly with future investment returns. For instance, one might combine the data from the Q Ratio, Crestmont P/E, PE10 and regression analysis to get a big picture view.
Here we can see that the stock market is pricier than it was in 1929. Moreover, overvaluation at a three standard deviation level is comparable to the brief insanity that occurred in 2000.
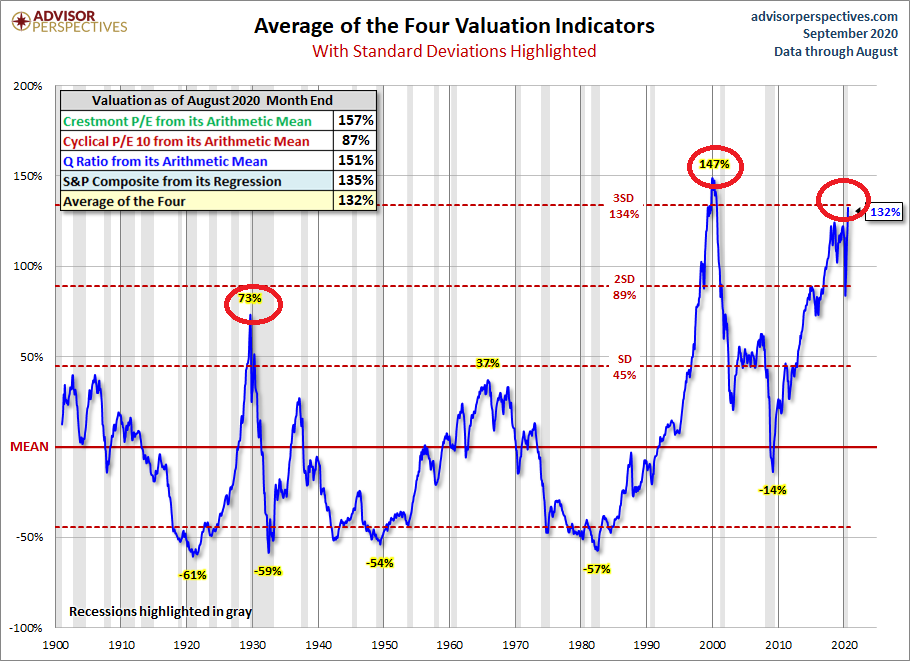
What does it mean when an aggregate valuation measure sits three standard deviations above an arithmetic mean? Since 99.9% of valuations will occur within plus or minus three standard deviations, the ‘three-sigma event’ represents less than 1% of all historical data.
Clearly, 2020 investors are playing with fire. Maybe even a wildfire.
In and of itself, an extremely pricey stock market does not spell doom. However, ongoing economic hardship could throw a monkey wrench in the ability to look beyond effervescent particulars.
For example, the collapse in commercial real estate demand adversely affects metropolitan areas. From restaurants to retailers, financial institutions to professional service firms, tourism to hotels, a quick fix is unlikely.
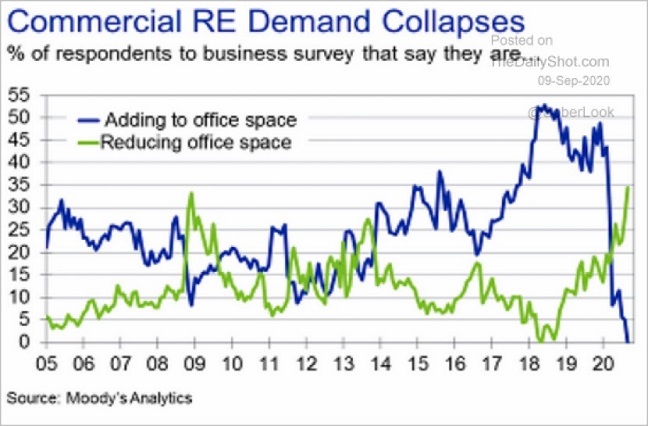
Would widespread vaccination be enough to alter the demise of office space demand? Will the economy be good enough for those living and working in big city environments? To bring employment back? To continue overlooking the frothiness of 2020 stock prices?
Would you like to receive our weekly newsletter on the stock bubble? Click here.