
It has been 20 years since the tech bubble burst. And it has been 12 year since the Bear Stearns bailout ushered in the Great Financial Crisis of 2008.
Lost in the shuffle? Long-term investing results.
Over 20 years, “risk-free” Treasury bonds have handily outperformed “risk-on” stocks. Gold has been the biggest gainer of them all.
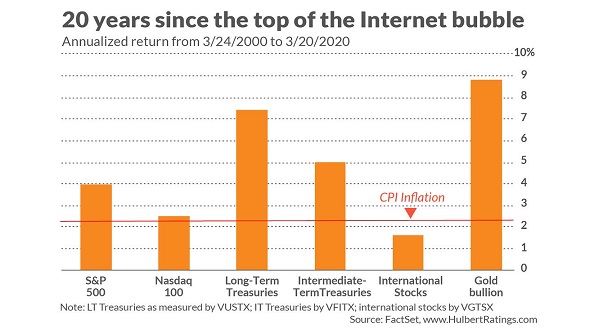
Here’s another reality if not a downright shocker… Long-term Treasuries have even outperformed stocks over 40 years.
Credit or blame the Federal Reserve. Committee chairs from Greenspan to Bernanke, Yellen to Powell, chose to “fix” every recession/crisis with ever-lower rate policies.
The Fed “fixed” the 2000 Internet Bubble by blowing the Real Estate Bubble. They “fixed” the 2008 Real Estate Bubble by blowing a 2020 All-Asset Bubble.
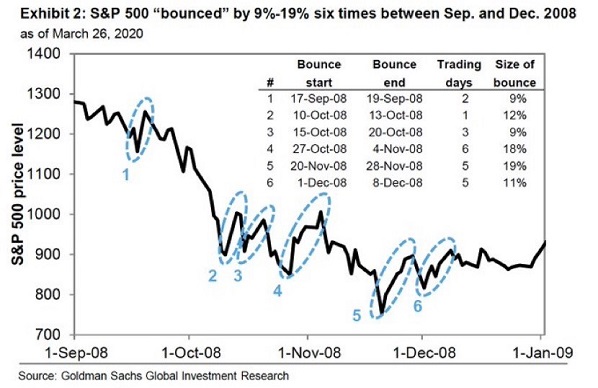
Can they “fix” the 2020 Bubble by inflating a fourth bubble for stocks, higher yielding bonds and real estate? When it comes to stocks, one should expect a series of rallies to falter.
In spite of massive Federal Reserve and federal government intervention, six bear market rallies of 9%-19% failed in 2008. The stock market bottom did not arrive until March of 2009.
The financial media would like you to believe that COVID-19 is the sole reason for economic hardship and financial market losses. Unfortunately, few outlets have been willing to dig deeper beneath the surface.
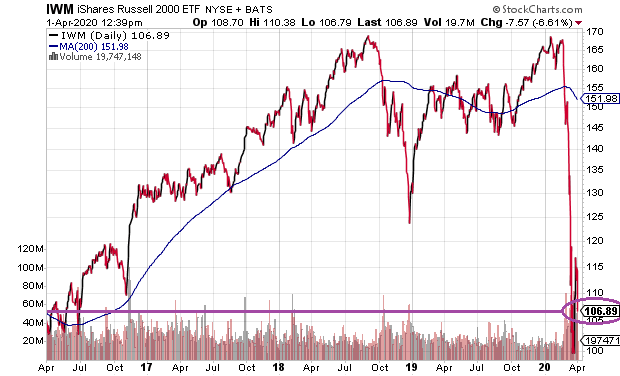
Before the virus, 36% of companies in the Russell 2000 experienced pre-tax income that was negative. Meanwhile, one-quarter of S&P 500 companies (>$10 billion market cap) had negative year-over-year earnings per share (EPS) growth. These “results” came prior to 2020 getting underway.
“But unemployment was at multi-decade lows,” you say. “People working had money to spend, didn’t they?”
Ultra-low unemployment is a classic late-stage indicator for economic cycles. And as far as what people had to spend, consumption capacity was already stretched to the nines.
For instance, before corona was a “thing,” consumer durables had declined 7.4% on a year-over basis. People had already been scaling back in a very big way on electronics, home furnishings, appliances, jewelry and exercise equipment.
It gets worse.
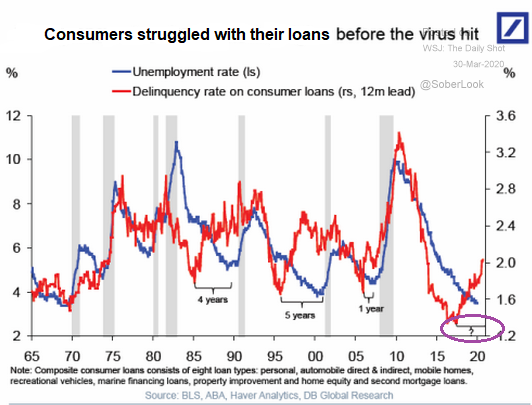
Consider the sharp rise in delinquency rates for consumer loans. Sometimes the indicator takes many years before recessionary pressures strike. Nevertheless, consumers at “full employment” were having difficulty paying back all kinds of loans, from credit cards to auto, from student to mortgage.
The answer to all our prayers is supposed to be stimulus. The federal government signed a $2 trillion package, and there are reports of bi-partisan support for yet another package.
Rarely discussed is whether families will acquire more “stuff” with their checks, or will they choose to pay down debts. Count on the latter.
And there’s the unfathomable amount of loans, bailouts and liquidity coming from the Federal Reserve. For context, recognize that in 2008, quantitative easing (QE) programs came in at $85 billion per month. Most recently? $625 billion… per week!
On top of all that, the Fed now has seven different programs for backstopping muni bonds, commercial paper, money markets, corporate bonds and multi-trillion dollar lending. Does this sound like the actions of a central bank that is seeking to mitigate a garden variety recession?
What you have, then, is a battle between the stimulus providers (e.g., Federal Reserve, White House/Congress, Treasury, etc.) and economic reality. And so far, economic reality has trumped depression-fighting stimulus efforts.
Oh, sure. We got that epic “dead cat bounce” in stocks. Yet in a country where small business is the soul and heart of our economic engine, the rally has been underwhelming.
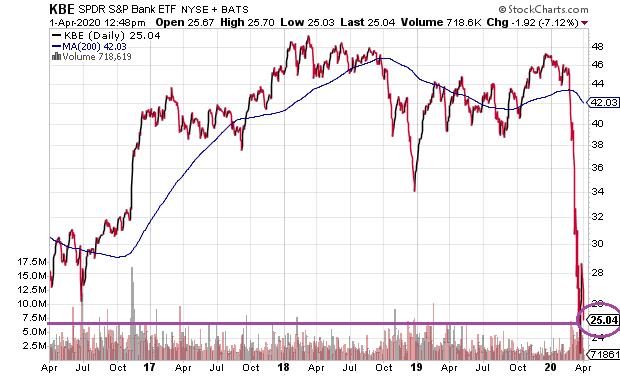
Keep in mind, some of the problems go beyond liquidity. Bank stocks remain down nearly 50% from 2018 highs because they’ve got toxic debts on their books.
Granted, a suspension of mark-to-market rules means that those losses won’t be recorded. But are they any less real? Price action in the SPDR S&P Bank ETF (KBE) tell you that those toxic debts are decidedly problematic.
It may be true to say that stocks may be getting closer and closer to “fair value.” On the S&P 500, for example, that may be in the neighborhood of 1970-2000.
On the other hand, bear markets tend to overshoot on the downside. It is similar to how bull markets overshoot on the upside.
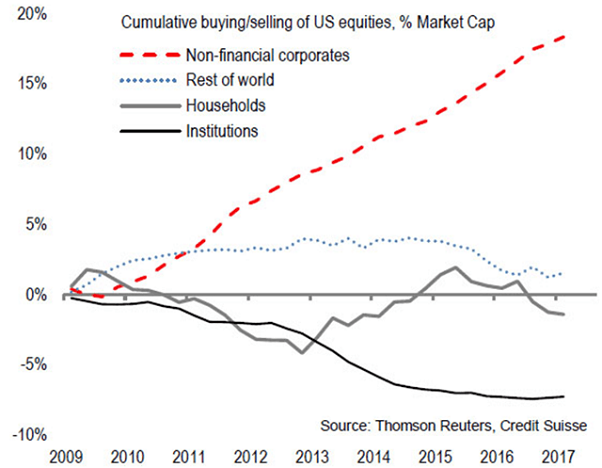
One has to consider that many of the things that helped stocks climb in the past are not going to be part of the equation for a period. Dividends? They’re being slashed as I type. Stock buybacks? Not only do many of the corporations not have the cash to pile money back into their stock shares, bi-partisan dissatisfaction with the buyback trend will stifle near-to-intermediate term buyback endeavors.
Limited dividends. Limited buybacks. Economic malaise. There may not be the same type of bull market support for quite some time.
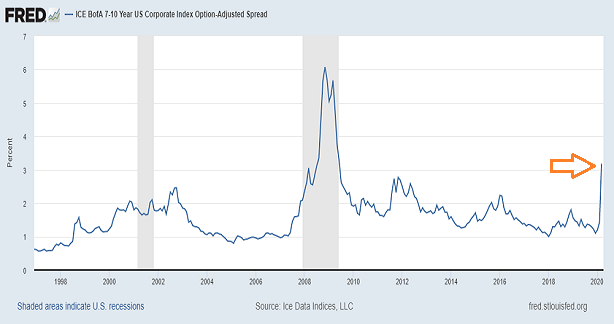
So how might one know when things have gotten cheap enough to add risk? Start with the credit markets. Specifically, credit spreads need to stop widening. They need to begin tightening in earnest.
The Fed’s rapid-fire decision to buy corporate bond ETFs as well as munis and mortgage-backed securities may keep spreads from widening as far as they did in 2008. However, the signs of sustainable tightening have yet to materialize.
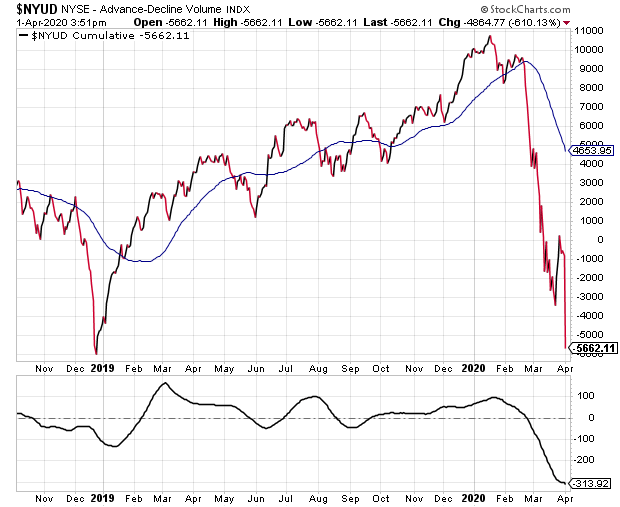
In a similar vein, when the Advance Decline (A/D) Volume Line for securities on the NYSE heads definitively lower, it is bearish for equities. This is particular true when the volume indicator is hitting lower lows — a sign of strong selling pressure.
On the other hand, if volume is strong enough on the upside, the A/D Volume Line will reclaim its 50-day moving average. It will also see its slope move higher and move into positive territory.
We also employ the monthly close on the 10-month SMA for the S&P 500. It helped us sidestep a large chunk of bearish price depreciation in the 2000 tech wreck as well as the 2008 financial crisis. It also helped us re-enter the ensuing bull markets at attractive entry points.
Admittedly, the speed of the current bear’s decline could make re-entry more challenging. If a V-shaped stock recovery truly came to pass, a 10-month trendline might not descend far enough to buy at significantly lower prices. That said, the signal to “de-risk” near 3000 on the S&P 500 is certainly giving our clients peace of mind.
In sum, I believe an investor would do well over the very long run to begin nibbling near fair value (S&P 500 approx 2000), even knowing that markets can overshoot to the downside. Names that I keep an eye on include Cisco (CSCO), Home Depot (HD), Mastercard (MA), Fortinet (FTNT), Crown Castle (CCI) and Pepsico (PEP).
On the flip side, without credit spread confirmation that financial markets are functioning smoothly, without favorable technical indicators and favorable market internals, and without a leveling of the virus itself, there’s little reason to take on additional risk. After all, things that are cheap can definitely get cheaper.
Please click here if you’d like to receive our weekly newsletter.